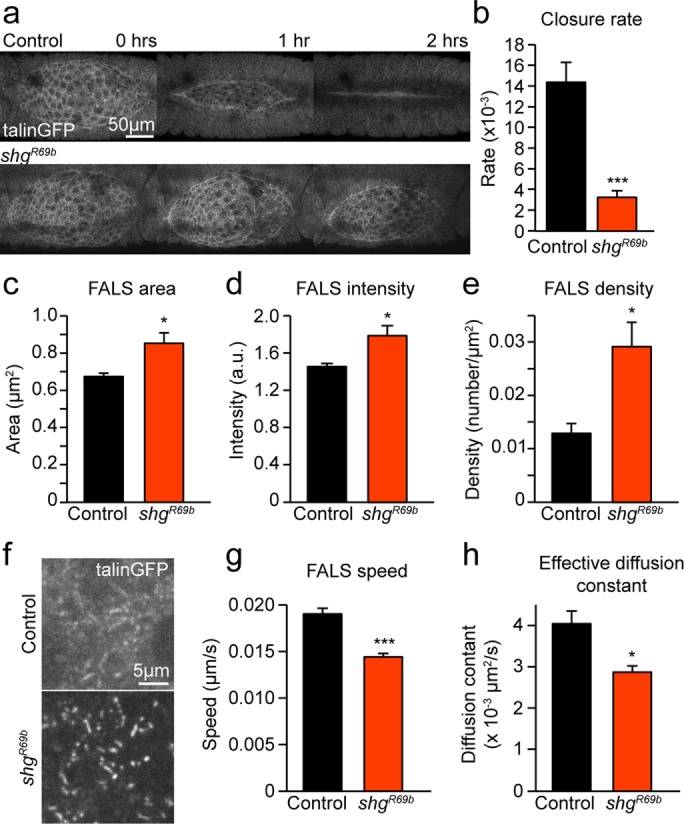
FIGURE 4:

Loss of cell–cell adhesion causes DC defects and an increase in the amount and stability of cell–ECM adhesions. (a) Sample z-projected images of control and shgR69b embryos expressing talin-GFP at 1-h intervals during DC. (b) Mean rate of dorsal closure in control and shgR69b embryos (five embryos). (c–e) FALS area (c), intensity (normalized to cytoplasmic intensity (d), and density (e) in control and shgR69b embryos (seven or eight embryos, 242–503 FALS). (f) Sample z-projected images of the basal domain of AS cells showing FALS in control and shgR69b embryos. (g, h) Mean speed (g) and effective diffusion constant (h) of FALS movement in control and shgR69b embryos (four to seven embryos, 34–58 FALS). Error bars indicate SEM. *p < 0.05, ***p < 0.0001.
