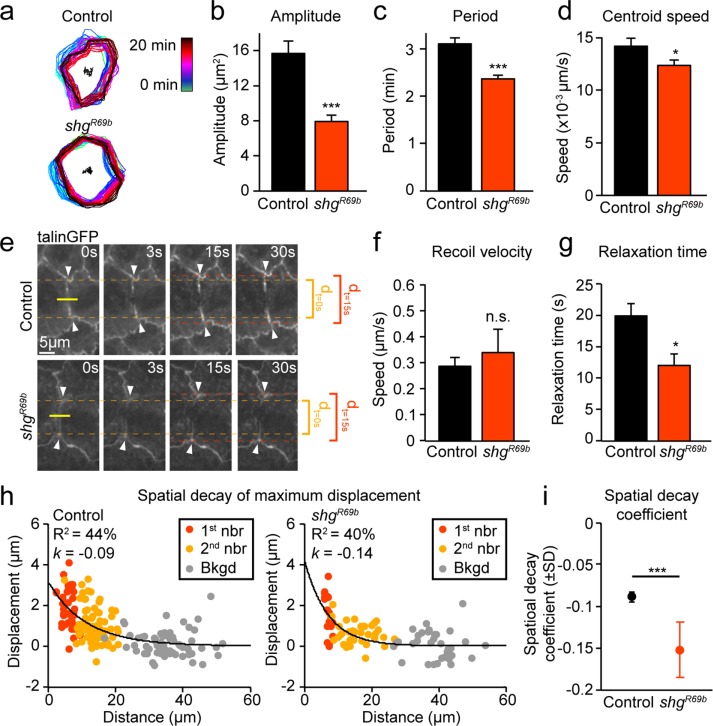
FIGURE 5:
Cell oscillatory behavior and force transmission are suppressed in shgR69b mutants. (a) Temporal overlay of cell contours 20 s apart from time-lapse movies of control and shgR69b embryos during early DC. (b–d) Mean amplitude (b) and period (c) of apical area oscillations and mean speed of apical cell centroid movement (d) for control and shgR69b embryos (four embryos, 21–25 cells). (e) Sample images of control and shgR69b embryos before and after laser ablation. Yellow line indicates cut location, and white arrows indicate tracked first-neighbor junctions. Junction separation at t = 0 (dt=0 s) and 15 s (dt=15 s) are indicated to help visually assess differences in separation over time between samples. (f, g) Recoil velocity (f) and relaxation time (g) of first-neighbor junctions after laser ablation in control and shgR69b embryos (13–24 cuts). (h) Spatial decay of maximum displacement in control and shgR69b embryos measured by fitting the maximum displacement of first-neighbor (1st nbr), second-neighbor (2nd nbr), and background (Bkgd) junctions to an exponential. R2 values and overall spatial decay coefficient (k) are indicated on plots. (i) Mean spatial decay coefficient in controls and shgR69b embryos. Error bars indicate SEM (unless otherwise indicated). *p < 0.05, ***p < 0.0001.

