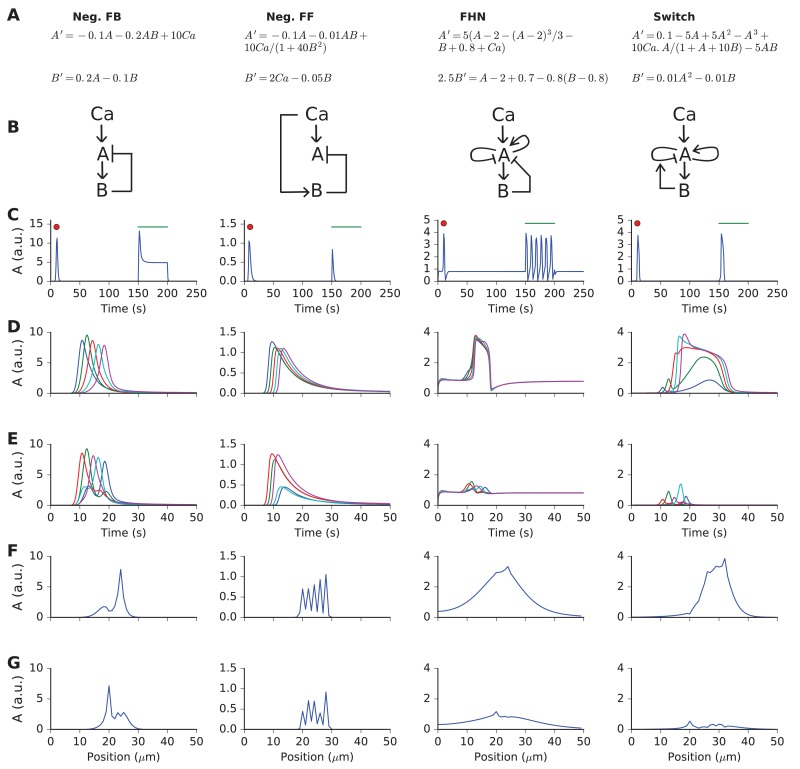
Figure 2. Responses and sequence selectivity of four abstract models involving molecules A and B.
Columns are the respective models. (A) Model equations. (B) Model schematics. Arrows indicate excitation, plungers indicate inhibition. In the FHN model, A has a fast self-excitation and a slow self-inhibition. In the Switch model, we indicate a multiplicative inhibition of A by an arrow from B onto the self-inhibition arrow of A. (C) Response of point (non-spatial) model to a 1 s wide Gaussian input of Ca2+ (red dot) and a steady pulse of Ca2+ (green line). Input amplitudes: 1, 10, 0.4, and 1 respectively. (D-G) Response of molecule A in one-dimensional reaction-diffusion form of model to sequential input at five locations. (D) Time-course of response at five locations to ordered input. Locations are color-coded in the sequential order blue, green, red, cyan, purple. (E) Time-course of response at five locations to scrambled input. Note that the FHN and Switch models have much lower responses to scrambled as compared to ordered input. The Neg. FF model has a lower response at two of its locations. (F, G) Snapshot of spatial profile of response to ordered (F) and scrambled (G) input. Snapshot is at time 18.4, 14.2, 16.3 and 18.4 s respectively.

