. 2017 Apr 19;6:e25827. doi: 10.7554/eLife.25827

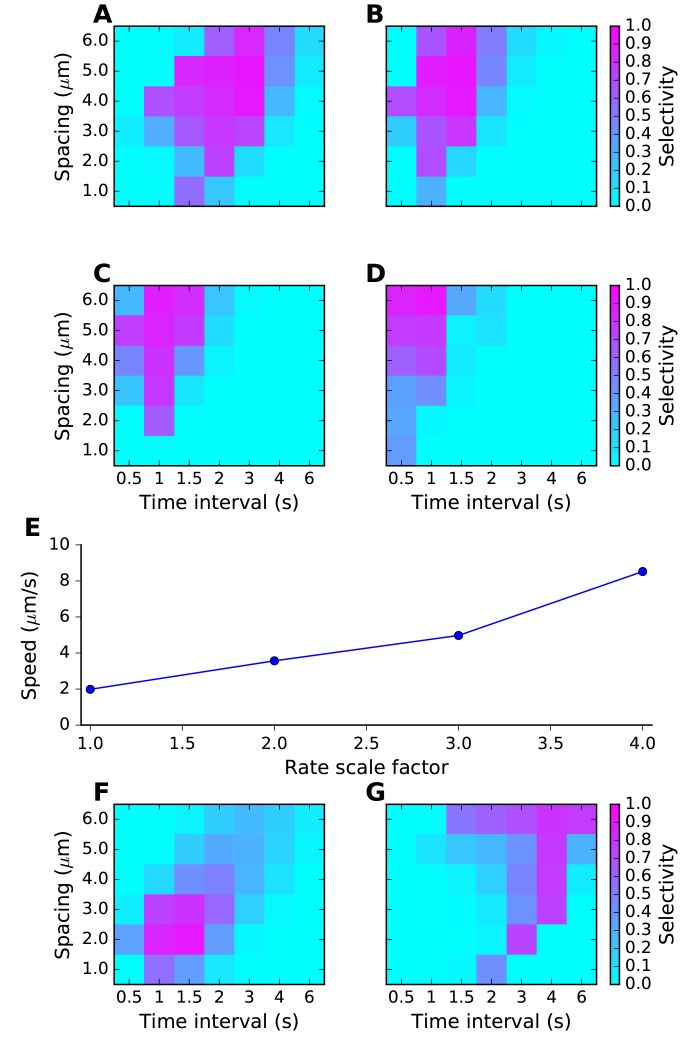
Figure 4. Sequence tuning ranges in space and time.

(A-D) tuning for rates of 1, 2, 3 and 4 times basal, respectively. (E) Plot of speed of sequence as a function of the rate scale factor. (F, G) Preferred space/time of tuning shifts with stimulus amplitude. (F) 90% basal. (G) 110% basal.

DOI: http://dx.doi.org/10.7554/eLife.25827.009

Figure 4.

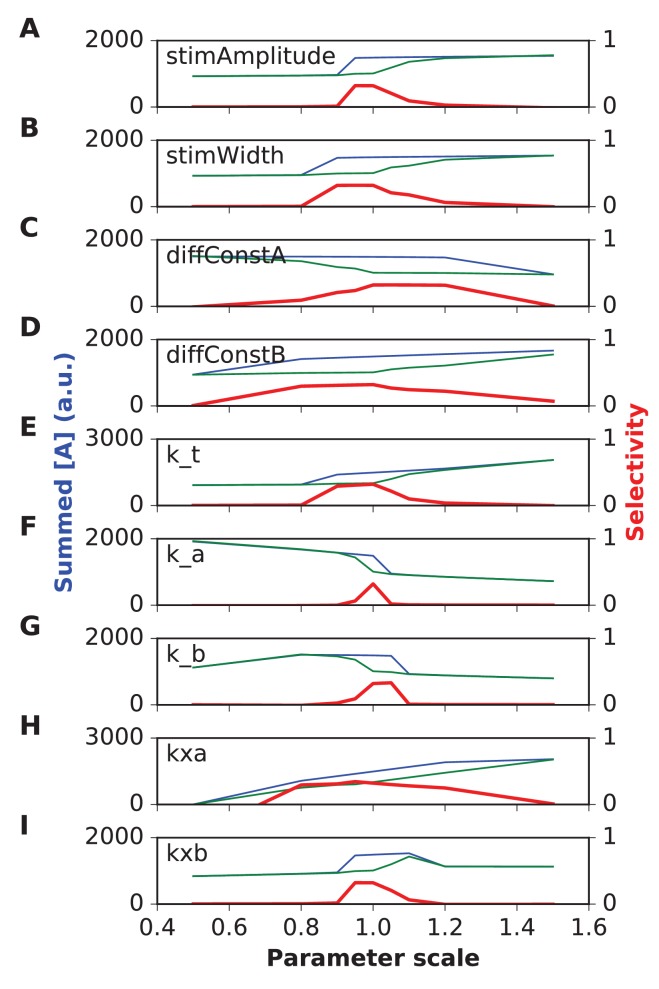
Figure 4—figure supplement 1. Parameter sensitivity for FHN (FitzHugh-Nagumo) reaction-diffusion model.

Figure 4—figure supplement 1.

In each plot, the blue trace is the summed concentration of A for the sequential stimulus, and the green plot is the mean of summed A over all permutations of the stimulus. A is summed over time since start of stimulus till end of simulation, and also summed over all five stimulus points. In each plot, the red trace is the selectivity metric (Equation 3). Note that the selectivity is largest when the ratio of blue to green traces is largest. Because of the high baseline in the FHN model, as seen in the blue and green traces, the selectivity (red traces) remains under 0.5. In each plot the x axis is scale factor of selected parameter with respect to the default model. Panel (A) Stimulus amplitude. (B) stimulus width. (C) Diffusion constant of molecule A. (D) Diffusion constant of molecule B. (E) rate constant for ‘t’ variable in FHN equations. (F) rate constant a. (G) rate constant b. (H) Offset term for variable A. (I) Offset term for variable B. Most parameters give good tuning for a range of ±10% around reference (1.0), but k_a is still more sensitive.
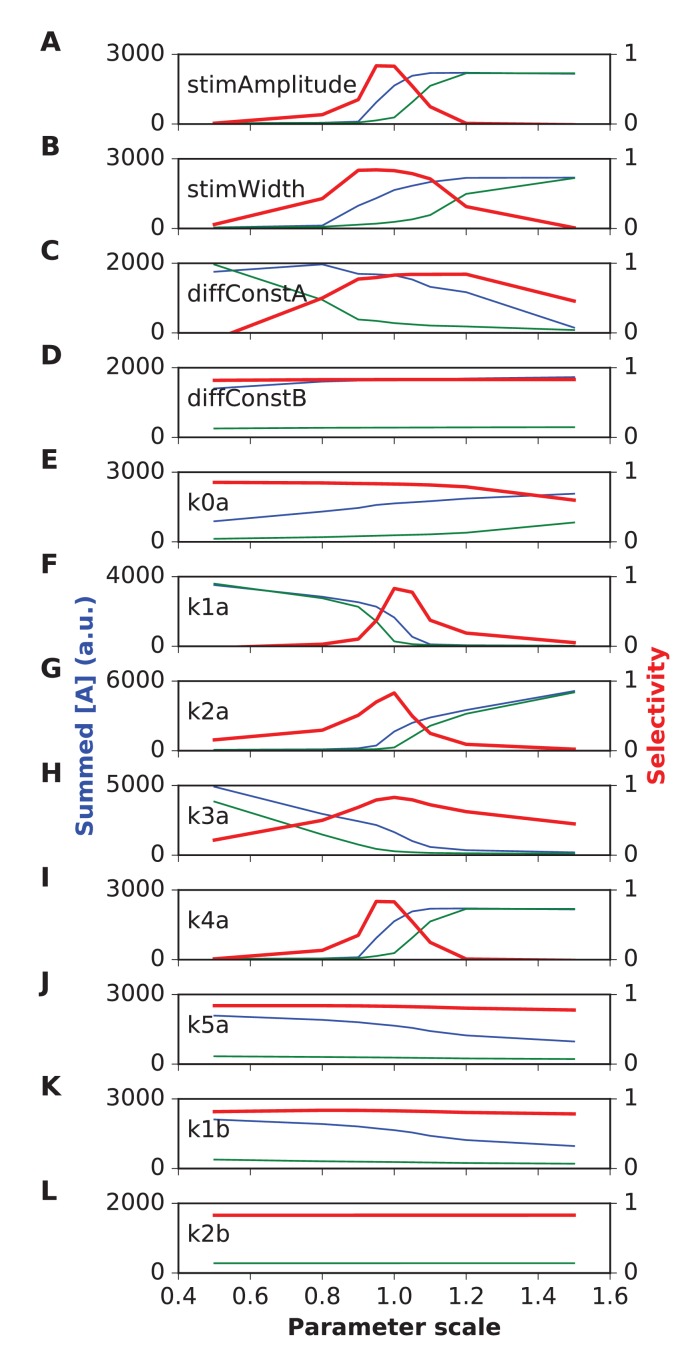
Figure 4—figure supplement 2. Parameter sensitivity for switch (Propagating bistable switch) reaction-diffusion model.

Figure 4—figure supplement 2.

Plot traces are as in Figure 4—figure supplement 1. Panel (A) Stimulus amplitude. (B) stimulus width. (C) Diffusion constant of molecule A. (D) Diffusion constant of molecule B. (E-L) Rate constants used in model. The model was sensitive to stimulus amplitude, and the rate terms k1a, k2a and k4a, and less sensitive for the rest. We classified sensitive parameters as those where selectivity fell below 0.5 for a parameter range of ±10% or less.