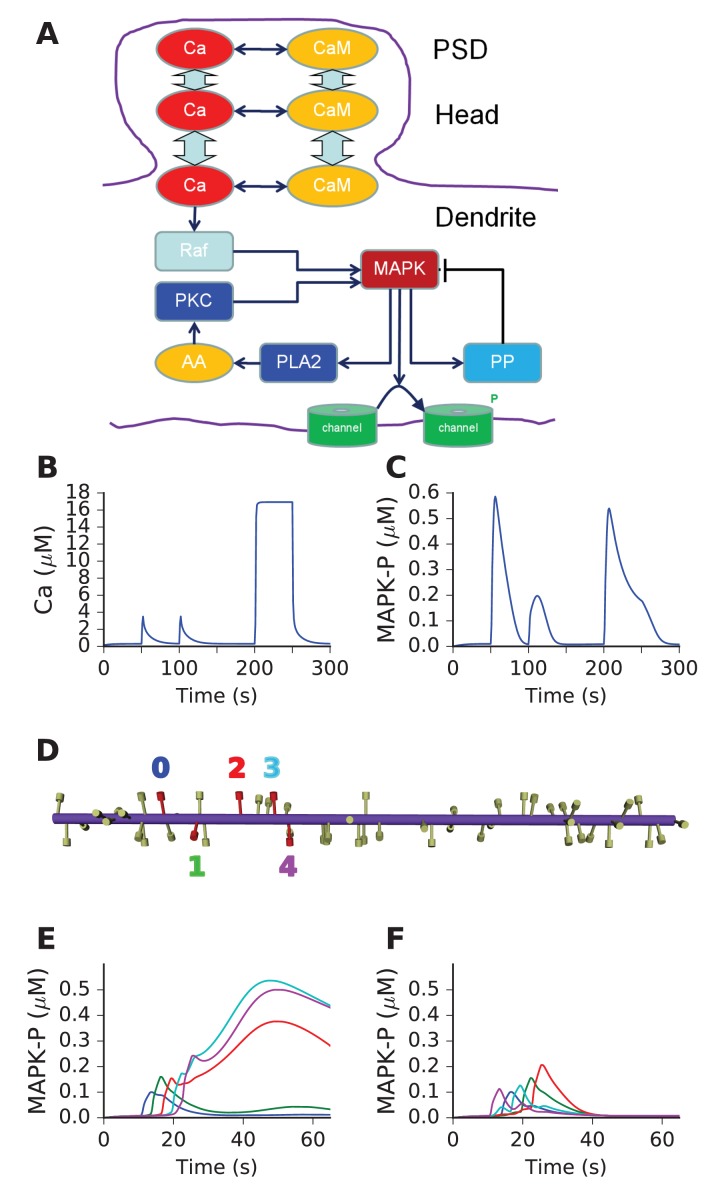
Figure 5. Mass action model of a MAPK switch exhibits sequence selectivity.
(A) Schematic of model chemistry. Black arrows indicate binding or activation reactions, plunger indicates inhibition, and bent arrow indicates enzyme activity. Broad cyan arrows indicate diffusion of Ca2+ and CaM between PSD, spine head, and dendrite. CaM buffers the incoming Ca2+ from the PSD. (B) Ca2+ responses seen at the dendrite, to input delivered at PSD. PSD stimulus was two pulses of 1 s, 160 mM Ca2+, separated by 50 s. After a delay of 100 s, a step of 160 mM Ca2+ was delivered for 50 s. (C) MAPK-P response to the Ca2+ stimulus. Note strong inhibition of the response to the second pulse, and rapid decline of response to the 50 step stimulus. (D) Geometry of 1-D reaction-diffusion model, with 49 spines. Dendrite diameter was 1 μm and length was 60 μm. The five stimulated spines are in red, each identified by a color coded number. (E) Response of system to sequential input [0,1,2,3,4] on indicated spines spaced ~3 μm apart, at intervals of 3 s. Each input was delivered to the PSD of the stimulated spine, at 160 μM, for 2.9 s. MAPK-P was recorded from the dendrite subdivision attached to each of the stimulated spines. Plot colors indicate stimulated spine from D. (F) Response to scrambled input, in the order [4,0,3,1,2]. The response to scrambled input had a smaller amplitude and lasted for a shorter time. Plot colors are as per spine numbers in D.

