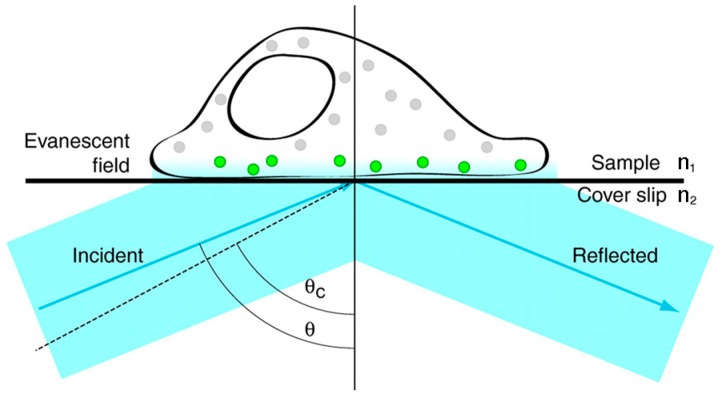
Figure 3.
Schematic diagram of total internal reflection fluorescence illumination. When the excitation beam travels across the coverslip-sample interface (n1 < n2) with an incident angle θ above the critical angle θc (indicated by the dashed line), the excitation beam is totally internally reflected back into the cover slip and an evanescent field is generated in the sample. Only fluorophores that are located in the evanescent field are excited (indicated by the green color). Here, n1 and n2 are, respectively, the refractive indices of the sample and the glass coverslip. Reproduced and rearranged from [34] with permission.

