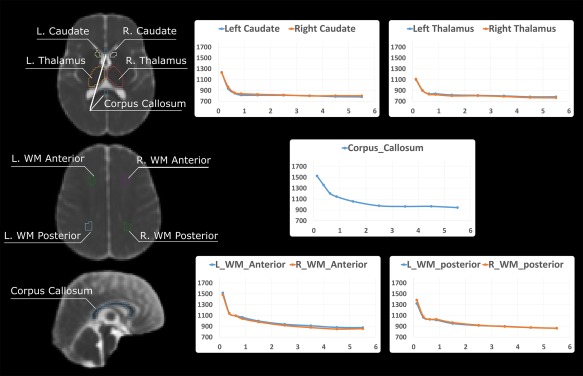
Figure 5.

Manual annotations of ROIs in a representative atlas (the Y2 age group), and the change of mean ADC values in these atlas‐based ROIs plotted with respect to age. The ROI annotations were done in 3D in all age‐specific atlases, but only representative 2D planes in the Y2 atlas are displayed here. In all plots, the x axis is age in years and the y axis is the mean ADC value in the ROI (unit: µm2/s). [Color figure can be viewed at http://wileyonlinelibrary.com]
