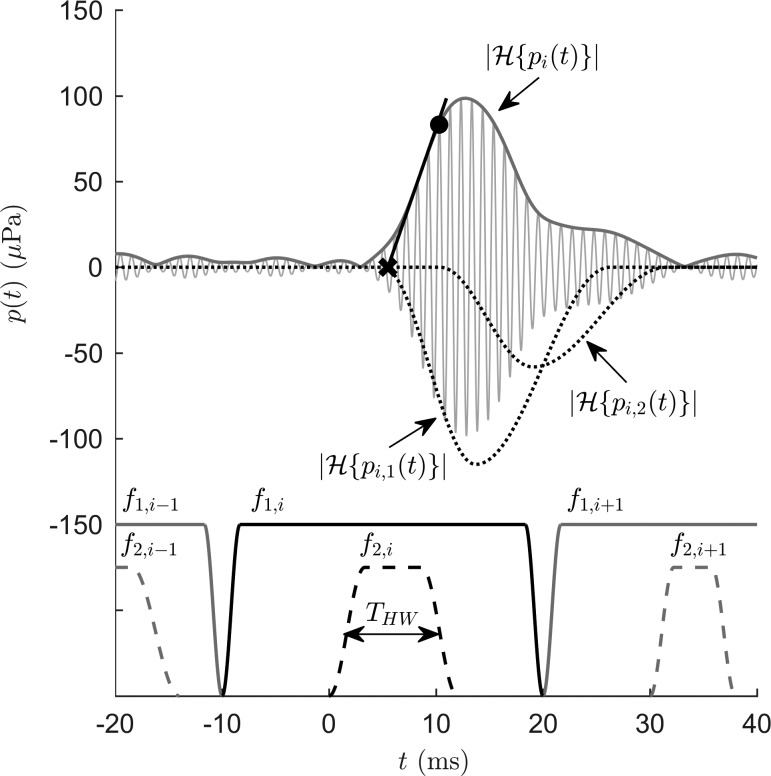
FIG. 2.
Stimulus and analysis paradigms. Upper part: Short-pulse DPOAE signal, , corresponding to the stimulus-frequency pair and after ensemble averaging and band-pass filtering (thin gray line), and its envelope computed as the absolute value of its Hilbert transform, (thick dark-gray line). Black dotted lines indicate envelopes of the nonlinear-distortion component, , and the coherent-reflection component, , extracted from the DPOAE signal using a nonlinear least-square curve fitting algorithm (Zelle et al., 2013; Zelle et al., 2015b). For visualization purposes, and are shown in reverse y-direction. The shorter latency of enables separation of the two DPOAE components in the time domain. An automated detection algorithm computes the onset of the DPOAE signal (black cross) as the intersection of the tangent (black line) with the abscissa. Using this DPOAE onset, the sampling instant for onset decomposition (black dot) is chosen according to Eq. (5) to estimate the amplitude of before starts to interfere. Lower part: Schematic of the arrangement of the stimulus pairs (amplitudes not to scale) interlaced in the time domain with f1 pulses of 30-ms duration and f2 pulses of frequency-dependent half widths, THW. Data from subject S054, f2 = 1.5 kHz, L2 = 45 dB SPL.

