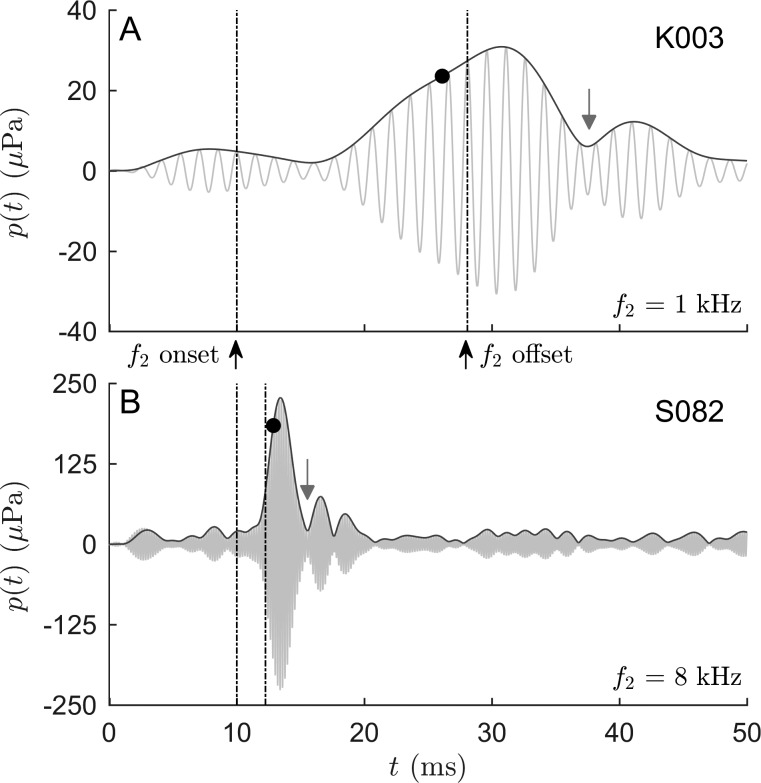
FIG. 3.
Short-pulse DPOAE responses (gray lines) recorded at f2 = 1 kHz (A) and 8 kHz (B) with L2 = 45 dB SPL. Dark-gray lines depict the envelope of the DPOAE with the black dots indicating the amplitudes of the nonlinear-distortion component estimated by onset decomposition, . Dash-dotted lines represent the onset and offset of the f2 pulses with frequency-specific full widths at half maximum corresponding to the expected delay between the two DPOAE components. With increasing stimulus frequency, both latency and duration of the DPOAE responses decrease considerably. The automated signal-detection algorithm accounts for individual variations in the delay to enable reliable, objective DPOAE-component separation using OD. In both examples, a notch in the DPOAE signal (gray arrow) indicates the presence of the two DPOAE components. For subject K003 (A), the notch is associated with a phase jump of 152° in the instantaneous phase (not shown) suggesting destructive interference. For subject S082 (B), the associated phase jump is 321°, which indicates that the notch stems from a delay between the two DPOAE components exceeding the duration of the nonlinear-distortion component.

