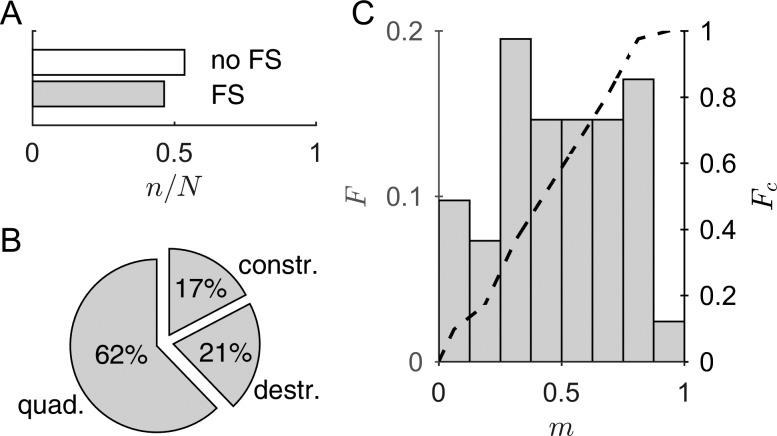
FIG. 4.
Statistics associated with fine structure. (A) Number of I/O functions, , relative to the total number of computable I/O functions for the pooled data, , divided into two groups according to the presence of underlying fine structure (FS) at L2 = 45 dB SPL. Definition of the FS group: Amplitude of the coherent-reflection component greater than or equal to 25% of the amplitude of the nonlinear-distortion component; conversely, for the no-FS group. (B) The FS-group was further divided into three types of interference: quadrature (quad.), destructive (destr.), and constructive (constr.), depending on the relative phase difference between the two DPOAE components (Sec. II F). (C) Normalized histogram, F, of the relative occurrence, m, of FS-affected I/O functions across subjects. m tends toward a uniform distribution (one-sample Kolmogorov-Smirnov test, p = 0.14). The dashed line corresponds to the empirical distribution function, Fc. It indicates that 41.5% of the subjects have at least half of their computable I/O functions belonging to the fine-structure group.

