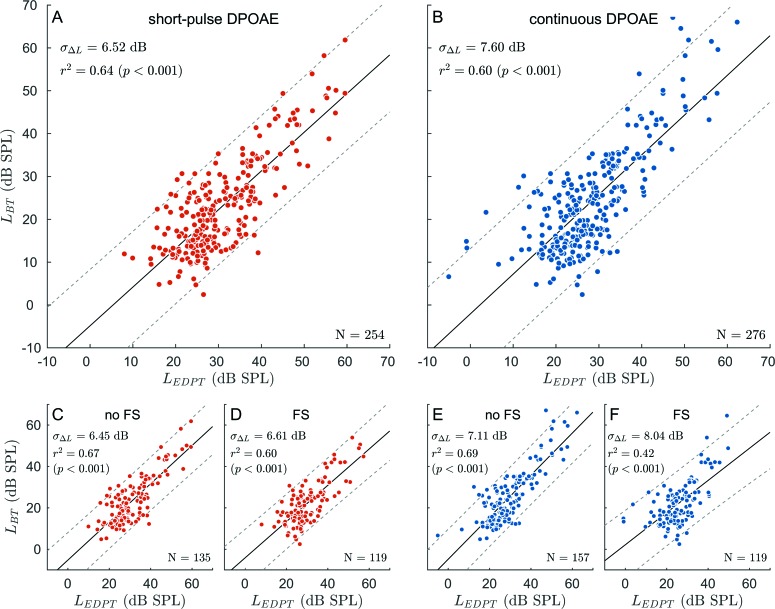
FIG. 6.
Correlation of the behavioral thresholds, LBT, with estimated distortion-product thresholds, LEDPT, for short-pulse (A) and continuous (B) stimulation pooled over all subjects and frequencies. (C) and (D) Scatter plots, for short-pulse DPOAEs, for the two subsets associated with I/O functions with (D) and without (C) fine-structure (FS) at 45 dB SPL. (E) and (F) Equivalent representation for continuous DPOAEs. Black solid and gray dashed lines in all panels represent the corresponding regression lines and the 95% confidence intervals, respectively. Regression parameters are given in Table II. In general, EDPTs derived with short-pulse DPOAE I/O functions relate more accurately to BTs with less scatter compared to EDPTs based on continuous DPOAEs [(A) and (B)]. A major reason for the performance differences between the stimulus paradigms is interference between the two DPOAE components, which becomes evident when comparing the scatter plots of the FS-affected groups [(D) and (F)] particularly for continuous DPOAEs.

