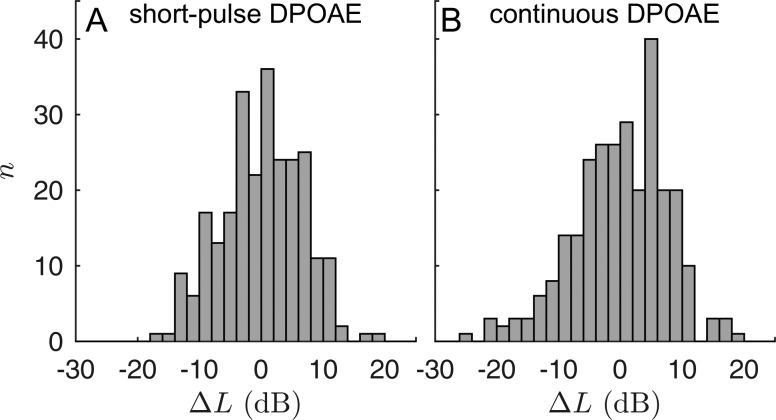
FIG. 7.
Histograms of the difference between LEHT given by Eq. (7) and LBT, for short-pulse (A) and continuous (B) acquisition. The data are normally distributed with zero mean and standard deviations of 6.52 dB (one-sample Kolmogorov-Smirnov test, p = 0.82) and 7.60 dB (p = 0.38) for short-pulse and continuous stimulation, respectively. The variance of the differences for the short-pulse data is significantly lower than that of the continuous data (one-sided F-test, p < 0.01).

