
Figure 3.
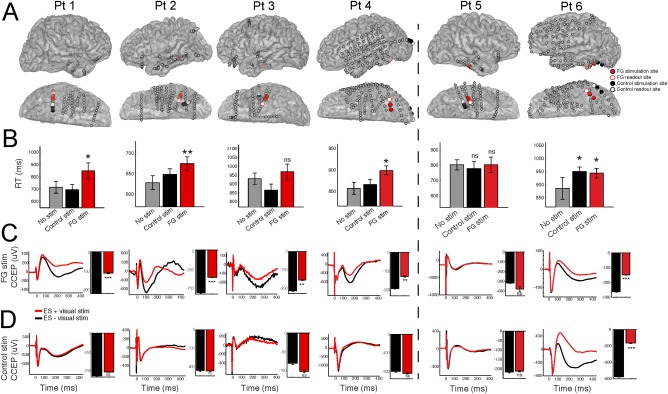
Single subject electrophysiology predicts the perception of distorted faces. A: For each subject, the locations of the face‐selective and control sites are shown on the cortical surface. B: Single‐subject behavioral results. C,D: Single‐subject electrophysiology results. CCEP modulation by face viewing (ES + VS) recorded in the (C) FG and (D) control site. Each plot shows the average CCEP during face stimuli (ES + VS) compared with no visual stimuli (ES‐VS). Bar graphs quantify the strength of the N2 response of the CCEP during each condition. Error bars denote S.E. *P < 0.05; **P < 0.01; ***P < 0.001. [Color figure can be viewed at http://wileyonlinelibrary.com]