
Figure 4.
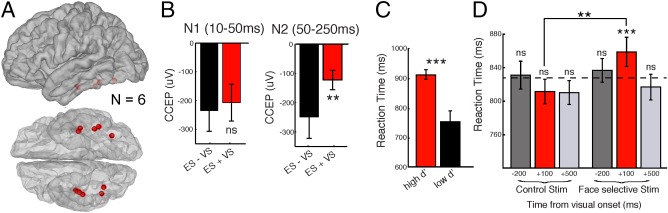
Group analyses of electrical modulation of the FG during face processing. A: The location of face‐selective sites (n = 6) used for ES. B: Electrophysiology results. Quantification of the N1 (10–50 ms) and N2 (50–250 ms) time period of the CCEP recorded at the FG during ES with and without VS. C‐D Behavioral results. C: Comparison of RTs for subjects with high d′ (n = 3 subjects) vs those with low d′ (n = 3 subjects). D: Median RTs for each condition across patients. Dotted horizontal bars for each condition represent the median RT for that condition. Error bars denote S.E. *P < 0.05; **P < 0.01; ***P < 0.001. [Color figure can be viewed at http://wileyonlinelibrary.com]