Figure 5.

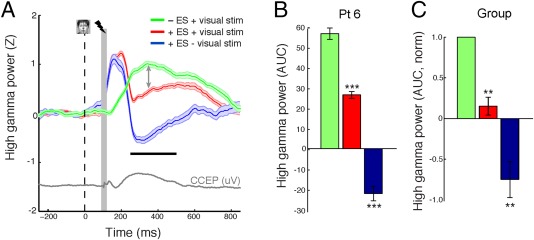
ES suppresses the high gamma power response to faces. A: High gamma power responses to different combinations of VS and ES. Gray trace represents the evoked potential following single pulse stimulation to the face‐selective region without concurrent VS. Face and vertical dotted line represent visual stimuli onset. The lightning bolt denotes the onset of ES (when applicable). Gray vertical bar denotes region of stimulation artifact that was not used in the analysis. Horizontal black bar illustrates the time period with which the AUC was computed on a single trial basis. Vertical arrows represent the decrease in HGP if face presentation is paired with ES. B,C: Quantification of HGP responses in (B) a single subject and (C) across subjects. [Color figure can be viewed at http://wileyonlinelibrary.com]
