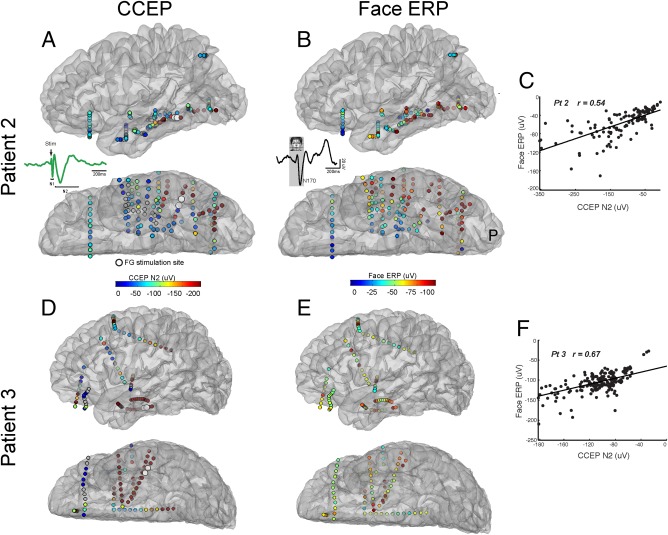
Figure 6.

ES of the FG is largely contained within regions involved in face processing. A: Map of CCEP connectivity assessed by face‐selective ES in one patient (Pt 2). Warmer colors represent stronger evoked response during the N2 time period. Insert: Components of the CCEP. Note the early N1 and later N2 time period of the evoked response. B: Map of N170 amplitude following face stimulation. Warm colors represent stronger N170 responses. Insert: Components of the face ERP. C: Correlation between isolated face‐selective CCEP maps and visual ERP maps in one patient. Note the significant correlation between the distribution of the two networks defined through electrical and VS, respectively. D–F: Same as A‐C but for a second patient.
