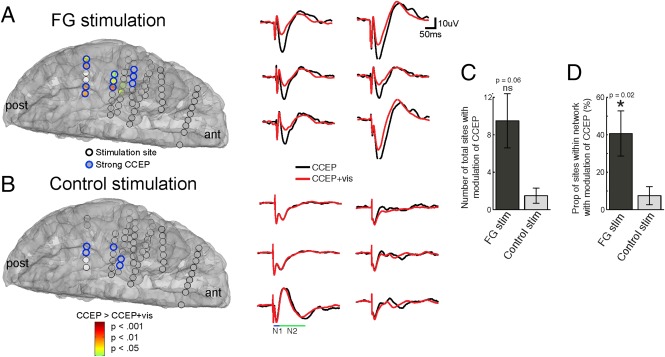
Figure 7.

Modulation of the CCEP by VS occurs at multiple sites that are functionally connected to the FG. A: Color brain map represents regions with significant CCEP differences between ES of face‐selective sites during rest (CCEP condition) and during VS (CCEP + vis condition). Representative changes from six electrodes are shown on the right. ant = anterior; post = posterior. B: Identical to A but map shows significant differences between ES of place‐selective control sites during rest and during VS. C,D: Group analysis (n = 6) demonstrating the (C) total number of electrodes across the brain and (D) the proportion of electrodes within each network with significant changes between CCEP and CCEP + vis conditions.
