
Figure 1. ZapA structures persist after FtsZ-ring disassembly.
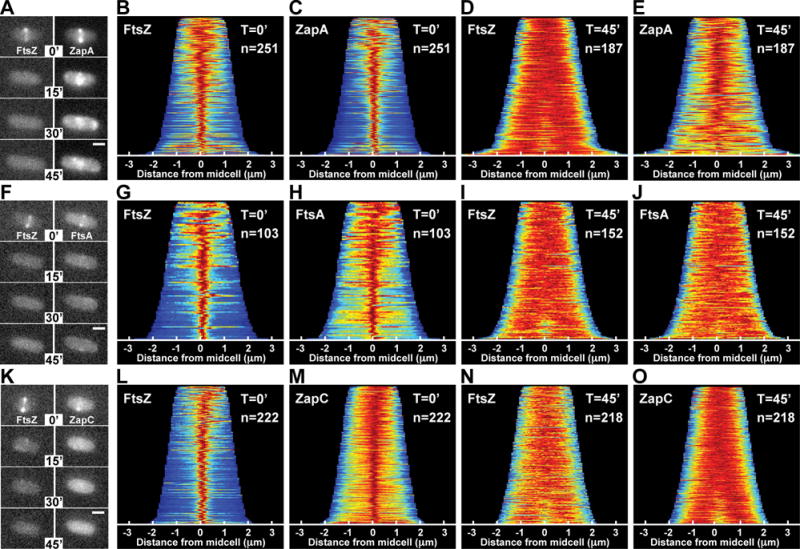
The localization of mCherry-FtsZ (expressed from attλNP145) and either ZapA-GFP (A–E, from its native chromosomal locus), GFP-FtsA (F–J, expressed from attHKHC427) or ZapC-GFP (K–O, expressed from attHKNP162) was followed in wild-type cells during a time-course following sulA induction from pNP146 (0–45min). (A,F,K) Montages of fluorescence images depicting representative single cells in both color channels following sulA induction (0–45min). The protein fusion being monitored is indicated in the top panel (left, red channel; right, green channel). (B–E, G–J, L–O) Population demographs illustrate the localization trend of an indicated fusion protein for a representative population immediately following sulA induction (T=0′) or 45min post-induction (T=45′). The majority of cells at T=0′ display midcell localization for all fluorescence constructs tested (B–C, G–H, L–M). At T=45′, only ZapA-GFP retains midcell localization (D-E, I-J, N-O). Midcell persistence of ZapA-GFP results in an altered appearance transforming from a tight-band (A,C) to a broad, cloud-like structure (A,E). Scale bars = 1μm.