
Figure 3. ZapA structures assemble between segregating nucleoids.
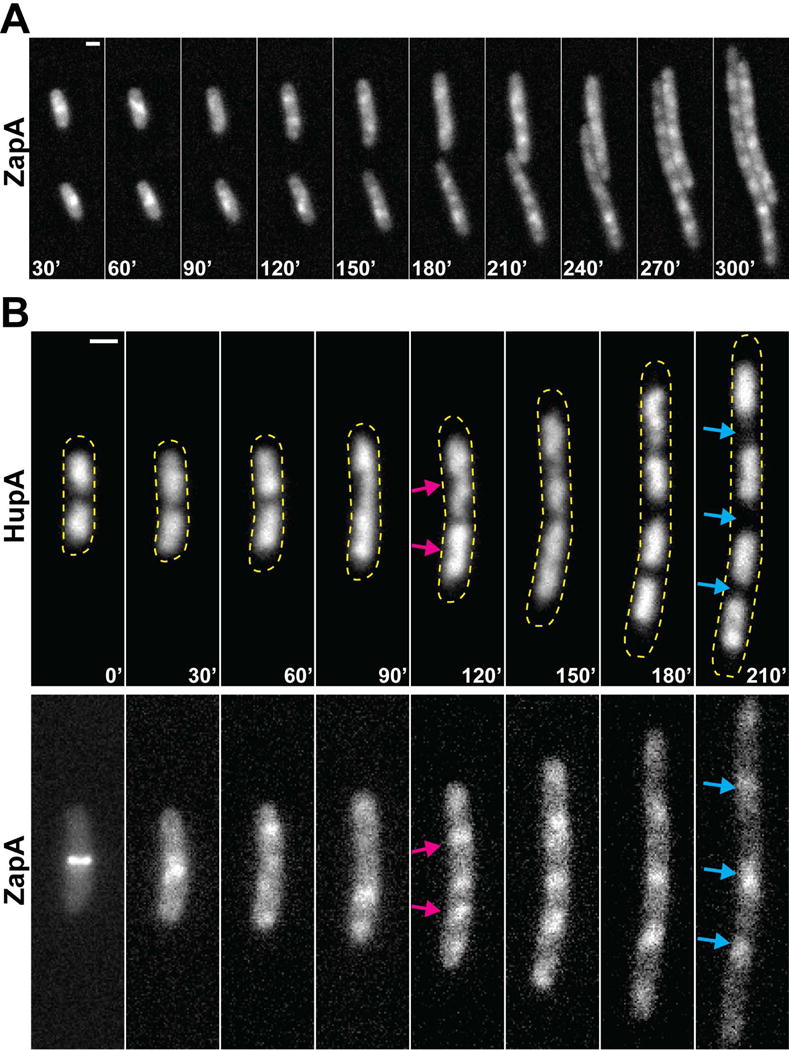
(A) Representative fluorescence time-lapse images of ZapA-GFP (expressed from its native locus in NP1) in two cells 30min after sulA induction from pNP146 (30–300min). (B) Representative fluorescence time-lapse images of a single cell expressing ZapA-GFP and HupA-mCherry (expressed from their native loci in NP127) during a time-course following sulA induction (0–210min). Arrows indicate ZapA-GFP localization between actively segregating (bilobed) nucleoids (magenta) or nucleoid-free regions (cyan). Yellow dashed lines approximate the cellular perimeter. Scale bars = 1μm.