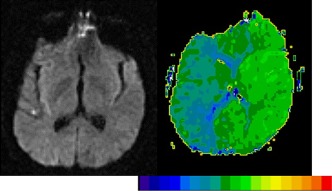
Figure 1.

DWI (left) and PWI (right) in a patient with severe deficits in all language tasks and right hemiplegia at Day 1. For the PWI, we computed time‐to‐peak (TTP), with bright green showing normal, fast blood flow while dark green and blue showing abnormally slow blood flow. Each color difference represents 2 s delay in TTP arrival of contrast. His deficits cannot be accounted for by the minimal infarct on DWI, but can be accounted for by the severe hypoperfusion of the whole left hemisphere. Scans in this and all figures are displayed in neurological convention (left hemisphere on left side). [Color figure can be viewed at http://wileyonlinelibrary.com]
