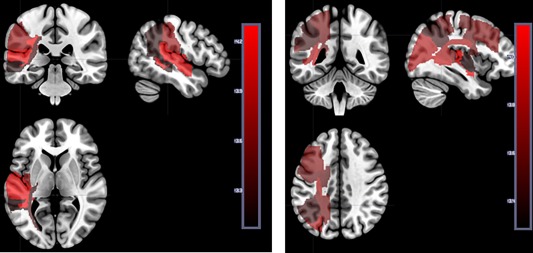
Figure 6.

Left panel: Areas where the number of voxels with tissue dysfunction (defined by DWI/PWI abnormality at Time 1) is significantly associated with lower accuracy on auditory word comprehension (defined by performance at Time 1). See Table 2 for Z scores for each region. Right panel: Areas where the number of voxels with tissue dysfunction (defined by DWI/PWI abnormality at Time 2) is significantly associated with lower accuracy on auditory word comprehension (defined by performance at Time 2). See Tables 1 and 2 for Z scores for each parcel. The scale shows the Z scores. [Color figure can be viewed at http://wileyonlinelibrary.com]
