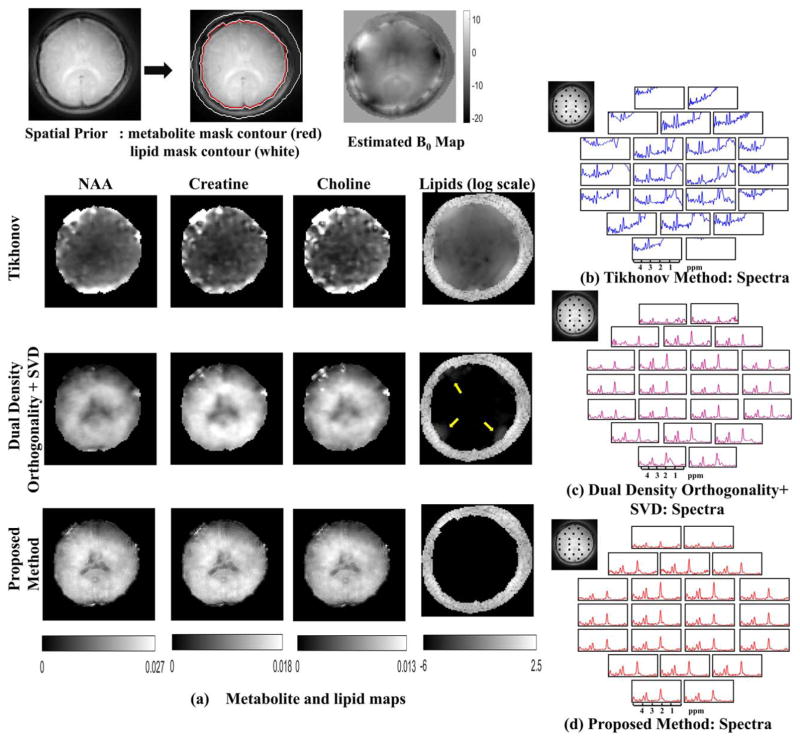
FIG. 8.
In vivo experiments without lipid suppression: The spatial contours for the metabolite and lipid region and the field map are shown in the top row. The metabolite maps and the lipid maps are shown for the Tikhonov method, dual-density orthogonality as in (40) followed by low-rank approximation (using truncated SVD) and proposed method in (a). The metabolite maps obtained from Tikhonov method are scaled up by 5 times. The color scale for the metabolite maps in the second and third row are shown below. It is observed that the proposed method has superior spatial details, whereas the dual-density orthogonality method has some residual lipids at the edges. Spatial details are lost for the dual density method because the metabolite data are limited to center k-space. The lipid for all the methods is plotted in the same log scale. The Tikhonov method has heavy lipid leakage in the metabolite region, whereas the dual-density method has some residual near the edges as shown by the yellow arrows. The proposed method on the other hand has no residual lipid in the metabolite region. Spectra from the locations marked in the reference image are shown in (b) for the Tikhonov method (in blue), (c) dual-density orthogonality followed by truncated SVD (in purple), and in (d) for the proposed method (in red).

