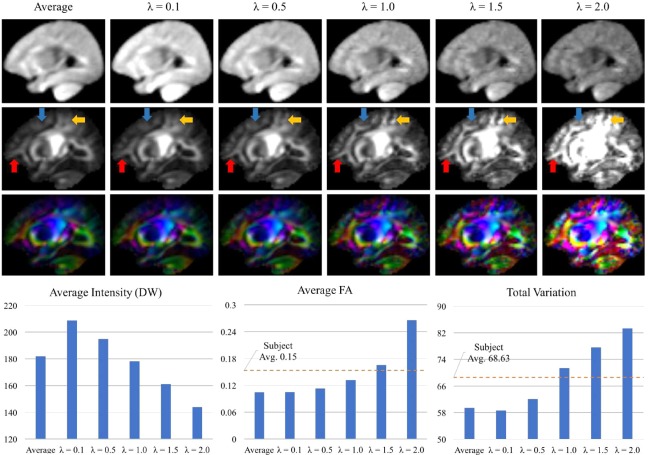
Figure 5.

Effects of the weight parameter λ for the regularization in the diffusion‐weighted (DW) atlas construction. The plots at bottom row indicate the average intensity of the visualized slice of the DW atlas, the average of its fractional anisotropy (FA) map, and the total variation of the FA map. “Subject Avg.” means the average of corresponding metrics from the training subjects, images. [Color figure can be viewed at http://wileyonlinelibrary.com]
