
Figure 8.
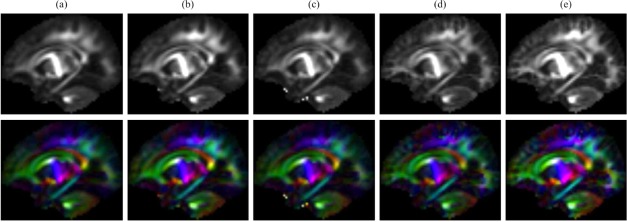
(Top) Fractional anisotropy (FA) and (Bottom) color‐coded FA maps of the diffusion‐weighted atlases, acquired by (a) average, (b) average of 4‐closest patches to average, (c) median, (d) sparse representation with spatial consistency, and (e) sparse representation with spatio‐angular consistency. [Color figure can be viewed at http://wileyonlinelibrary.com]