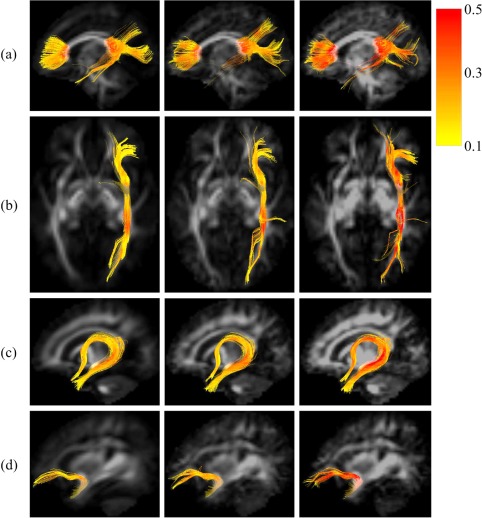
Figure 13.

Tractography of (a) corpus callosum (Fminor, Fmajor), (b) inferior fronto‐occipital fasciculus, (c) fornix and (d) uncinate fasciculus on the average atlas (left), spatially consistent atlas (middle), and spatio‐angularly consistent atlas (right). The colors indicate the value of fractional anisotropy (FA) along the tracts. Darker color shows higher value for FA. [Color figure can be viewed at http://wileyonlinelibrary.com]
