Fig. 3.

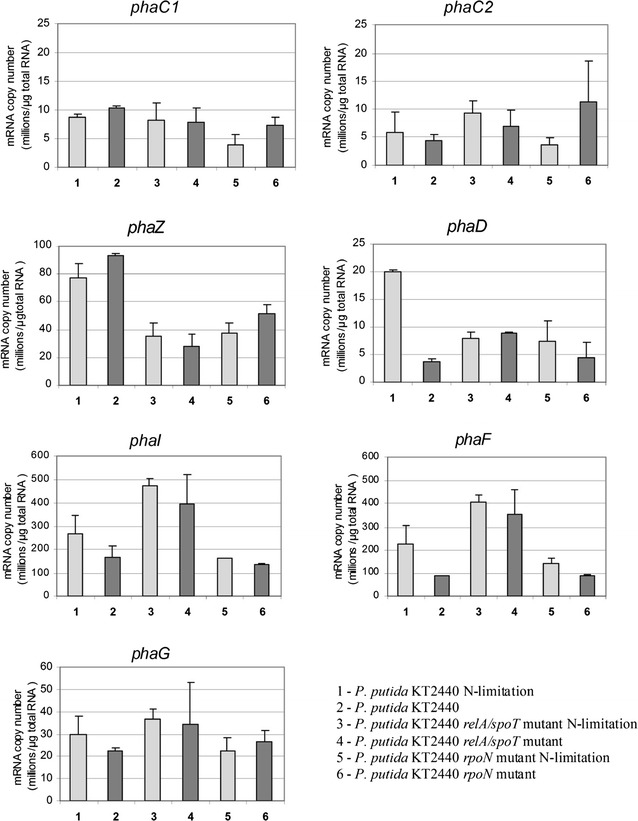
The result of quantitative real-time reverse transcription PCR analysis of phaC1, phaZ, phaC2, phaD, phaI, phaF, and phaG genes. Samples were taken at 48 h of cultivation. Each data represents the mean ± standard deviation

The result of quantitative real-time reverse transcription PCR analysis of phaC1, phaZ, phaC2, phaD, phaI, phaF, and phaG genes. Samples were taken at 48 h of cultivation. Each data represents the mean ± standard deviation