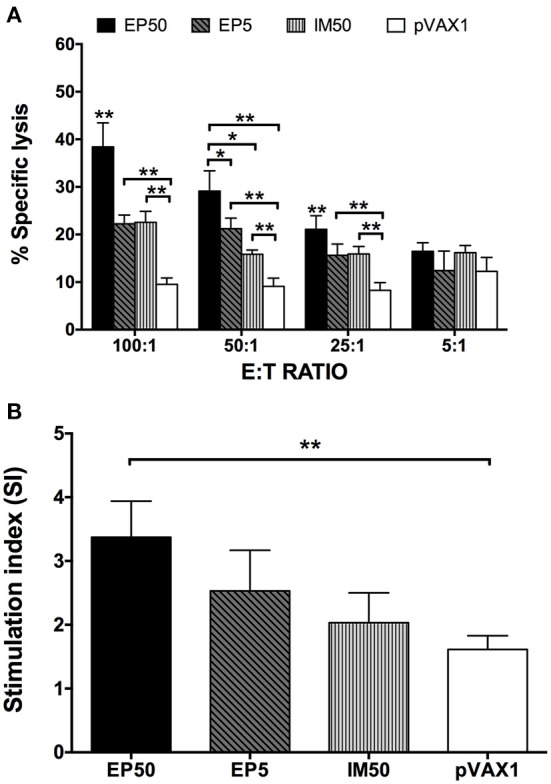
Figure 4.

DV1-specific cell-mediated immune responses in DNA-immunized mice. Splenocytes were isolated two weeks after the third immunization. (A) DV1-specific CTL response (n = 6). Percentages of specific lysis + SD were shown at different E:T ratios. (B) Lymphocyte proliferation measured with CCK-8 (n = 6). The results were recorded as the mean SI + SD. *p < 0.05, **p < 0.01.
