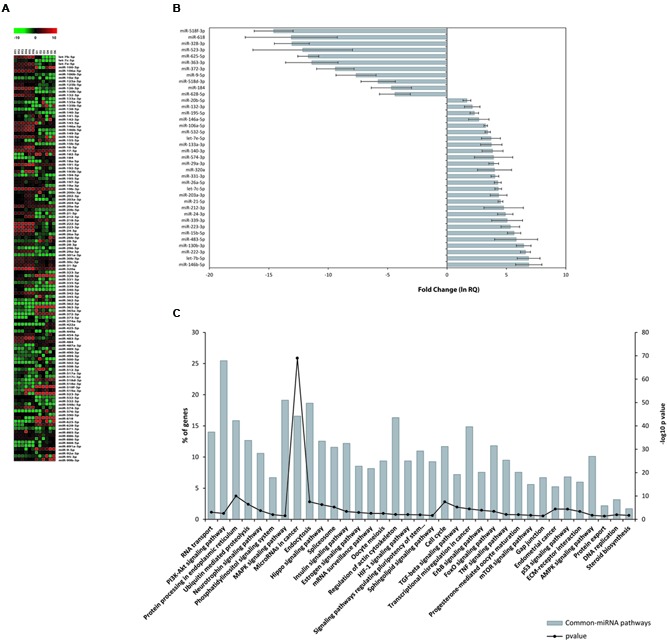
FIGURE 3.

miRNA expression in hFF and human oocytes. (A) Heat map of normalized miRNA expression data (–DCT values) of 118 Common-miRNAs for hFF and oocyte samples. The red and green colors represent up and down regulated miRNA expression levels, respectively. Equally expressed miRNAs are indicated in black. (B) Relative expression levels of 27 and 11 miRNAs that were differentially expressed between FF and oocytes. (C) Signaling pathway enrichment analysis for common miRNAs with KEGG against listed target genes. The probability values are reported as –log10 (P-value).
