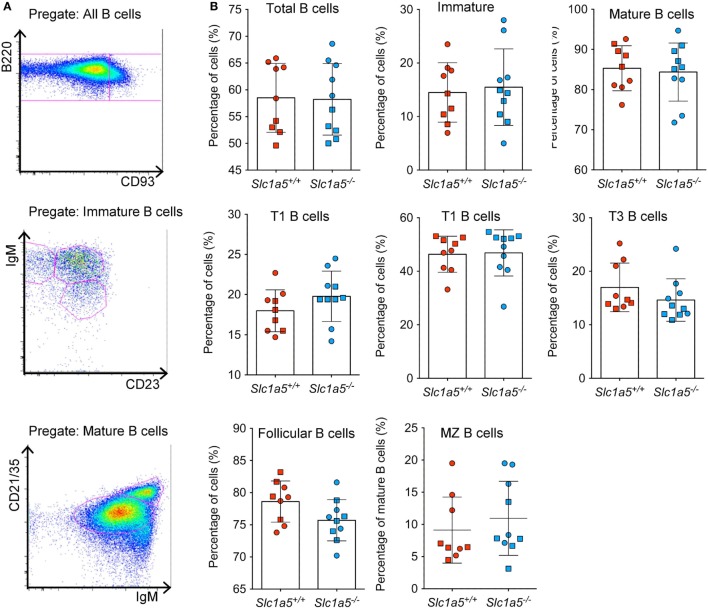
Figure 6.
Normal B cell development in the spleen of Slc1a5−/− mice. Representative gating strategy (A), and percentages of B cells at different developmental stages (B) in the spleen. Data were pooled from two separate experiments with 4–5 mice per group and experiment. Each experiment is shown by a separate symbol. Statistical analysis between Slc1a5+/+ and Slc1a5−/− mice was done using an unpaired t-test, no significant differences were found. Error bars show SD.

