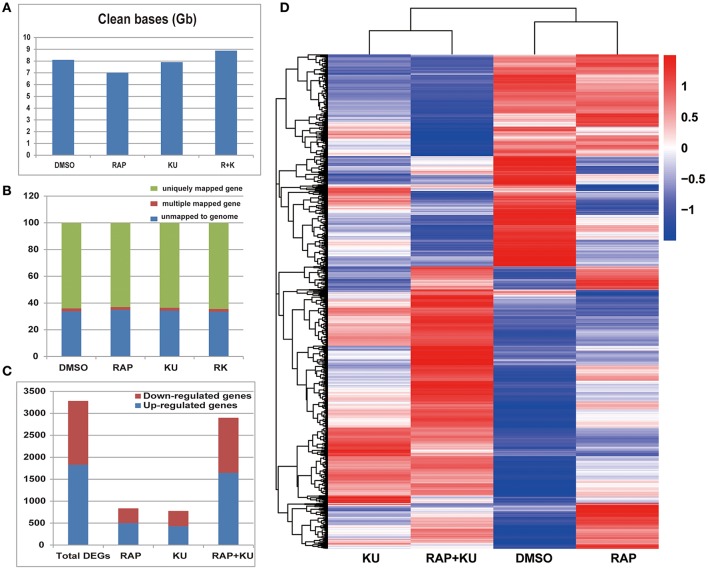
Figure 5.
The summary of basic information of the transcriptome data. (A) The number of clean bases in the treatments DMSO, rapamycin, KU, and rapamycin + KU. (B) The proportion of total clean reads in the four transcriptome libraries that mapped to the reference diploid potato genome. (C) The DEGs of all three transcriptome data from rapamycin, KU, and rapamycin + KU compared with the control DMSO. (D) Hierarchical clustering of the DEGs in the treatments of rapamycin, KU, and rapamycin + KU and the control DMSO. The blue bands indicate low gene expression quantity; the red bands indicate high gene expression quantity.

