Figure 8.
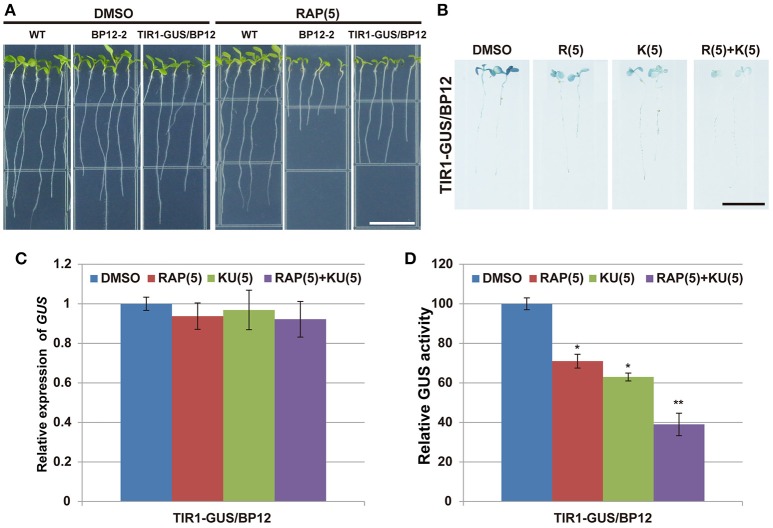
TOR was involved in TIR1 stabilization in Arabidopsis. (A) The phenotype of TIR1-GUS /BP12 line in medium with rapamycin, bar = 1 cm. (B) The GUS staining of TIR1-GUS /BP12 line under different TOR inhibitors treatment; DMSO was used as control, bar = 1 cm. (C,D) The relative expression of GUS and the relative activity of GUS in TIR1-GUS /BP12 line under different TOR inhibitors treatment, DMSO was used as control. Asterisks denote Student's t-test significance compared with DMSO (*P < 0.05; **P < 0.01). Each value represents the mean ± SD of three independent experiments.

