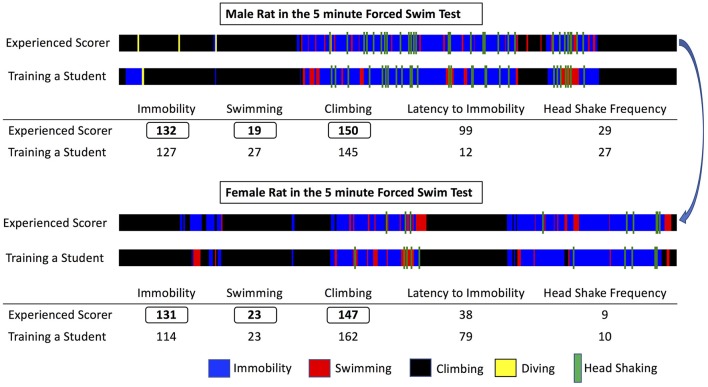
Figure 1.
Representative visual maps produced after scoring a male (top) and a female (bottom) rat during Forced Swim Test. The total length of the visual bar corresponds to the test duration (5 min) and each behavior scored is depicted with a designated color, its time of appearance and its duration. Note that both animals have almost identical total duration of immobility, swimming, and climbing, however the organization in time of the observed behaviors differs significantly between the male and the female rat. Also, note the slight differences between the experienced scorer and a trainee, the latter performing the scoring in a satisfactory way, if examining only the total scores, but still committing some errors when inspecting the visual maps. By comparing the produced visual maps and discussing the animal's performance training can be facilitated in an engaging way and reproducibility can be enhanced.

