
FIGURE 8.
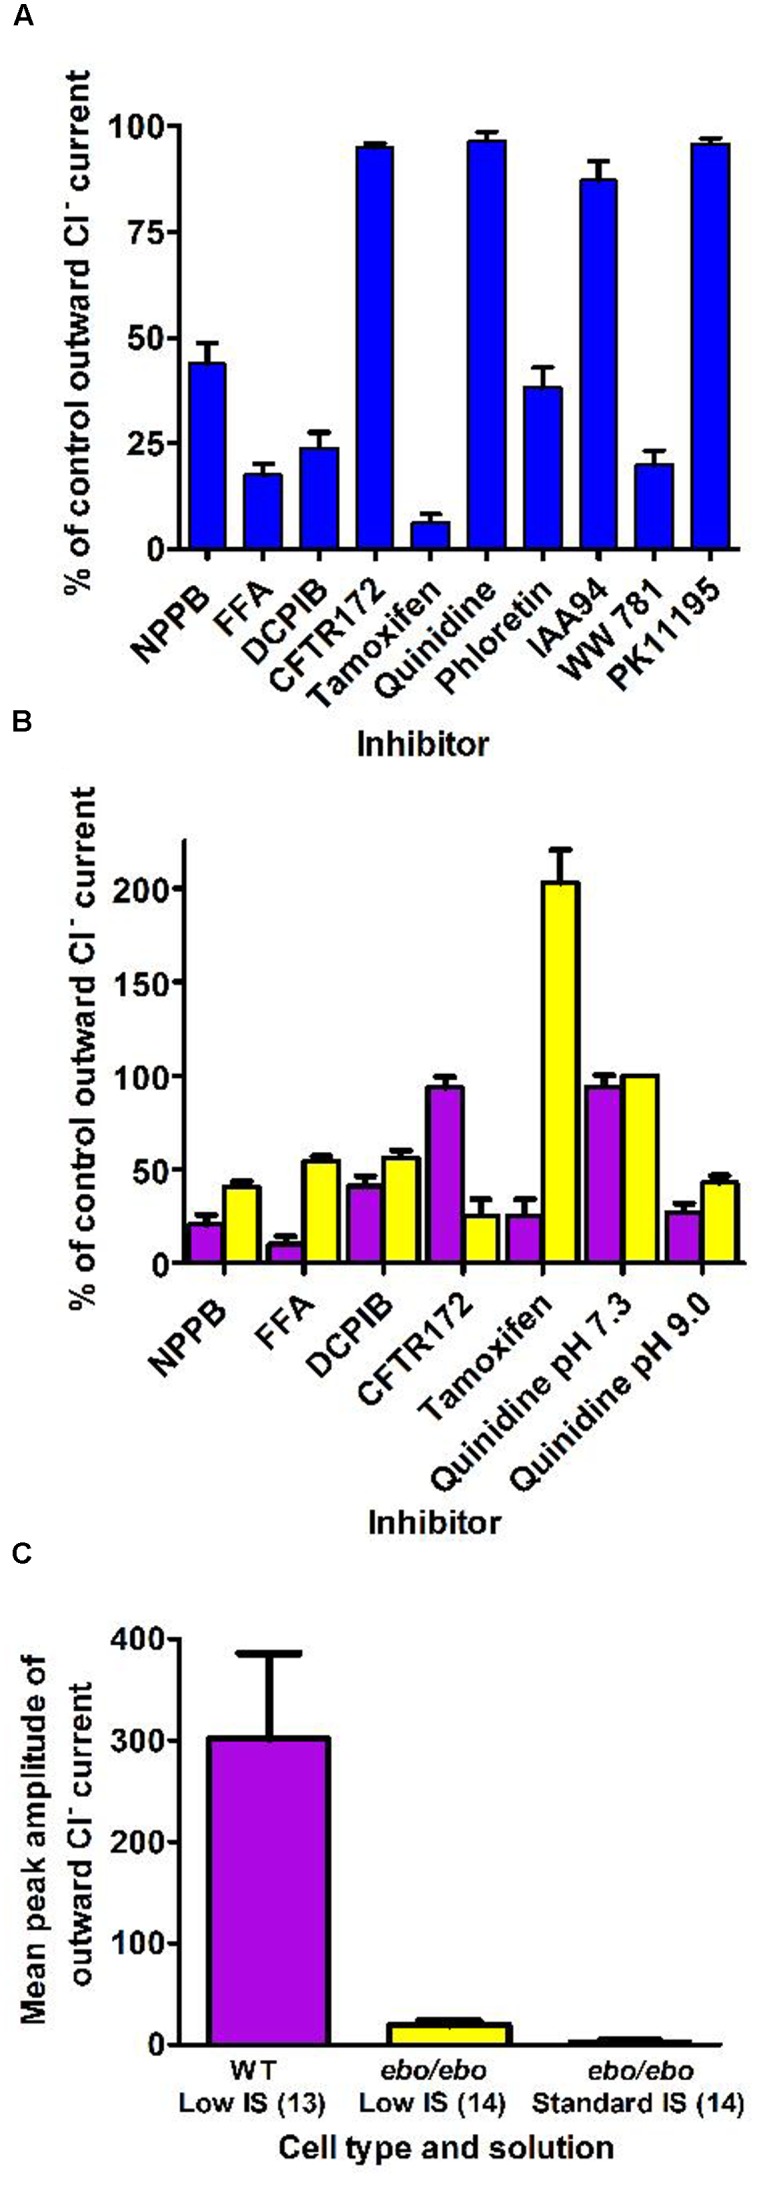
(A) Pharmacology of the dialysis activated current in HVCN1–/– C57BL/6 mice neutrophils. Concentrations of inhibitors used (numbers of cells tested) were: NPPB 100 μM (14), FFA 200 μM (13), DCPIB 10 μM (4), CFTR-172 10 μM (4), tamoxifen 10 μM (4), quinidine 100 μM pH 7.3 (5), phloretin 200 μM (2), IAA94 50 μM (6), WW781 25 μM (5), PK11195 20 μM (4). The error bars represent standard error of the mean. (B) Pharmacology of the Cl– current in WT BALB/c mice (purple bars) and of the residual Cl– current in the ebo/ebo BALB/c mice (yellow bars). Concentrations of inhibitors used (number of WT cells, number of ebo/ebo cells used): NPPB 100 μM (9,9), FFA 200 μM (5,5), DCPIB 20 μM (8,9), CFTR-172 10 μM (4,2), quinidine 100 μM pH 7.3 (4,2), quinidine 100 μM pH 9.0 (4,2), tamoxifen 10 μM (4,6). The error bars represent standard error of the mean. (C) Ionic strength sensitivity: while a significant reduction of the outward Cl– current recorded in low ionic strength intracellular solution is observed in ebo/ebo neutrophils compared to WT neutrophils, the residual Cl– current in ebo/ebo neutrophils remains largely sensitive to ionic strength when in standard ionic strength solution.