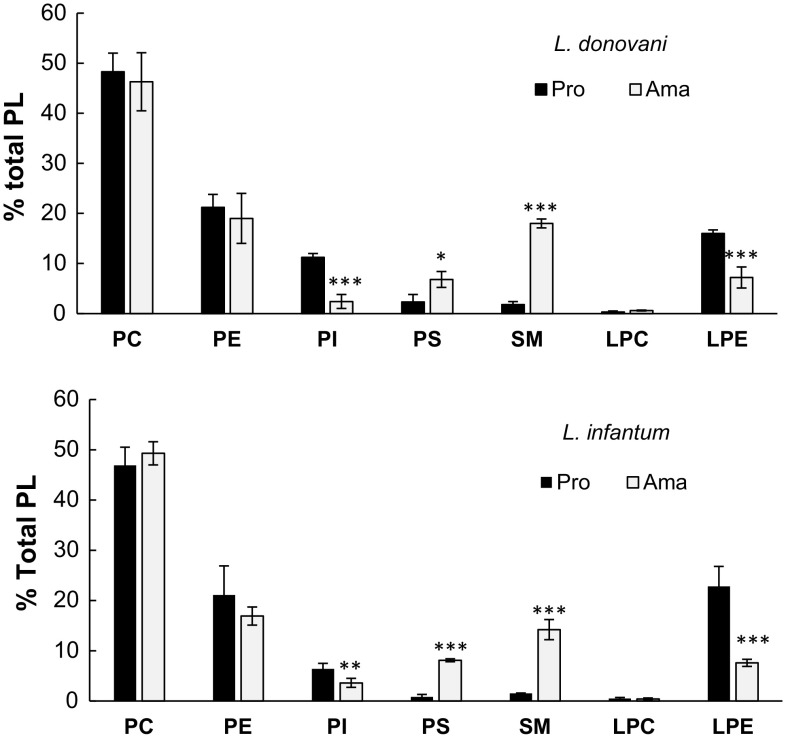
Fig. 3.
PL distribution in promastigote and amastigote. Lipid quantification was made by HPLC-CAD as detailed in materials and methods. The bars represent the % of total PL. Data are the means ± SD of four independent determinations. PtdCho phosphatidylcholine, PtdEtn phosphatidylethanolamine, PtdIns phosphatidylinositol, PtdSer phosphatidylserine, CerPCho Sphingomyelin, LPtdCho lysophosphatidylcholine, LPtdEtn lysophosphatidylethanolamine. *p ≤ 0.05, **p ≤ 0.01, ***p ≤ 0.001 significant differences between promastigote

