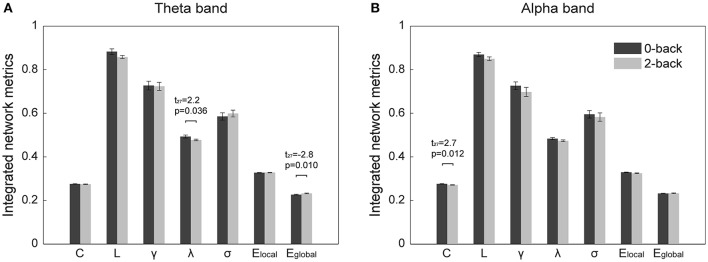
Figure 4.
Integrated global metrics (corresponding to the area under the curves of each metric over the entire sparsity range) of the cortical functional connectivity networks in the 0-back and 2-back tasks in (A) theta band, (B) alpha band. The metrics are (from left to right) clustering coefficient (C), characteristic path length (L), normalized clustering coefficient (γ), normalized characteristic path length (λ), small-worldness (σ), local efficiency (Elocal), and global efficiency (Eglobal). The bars represent mean ± standard error. The t- and p-values of the corresponding metrics showing statistically significant differences (p < 0.05) between the 0-back and 2-back tasks are presented.

