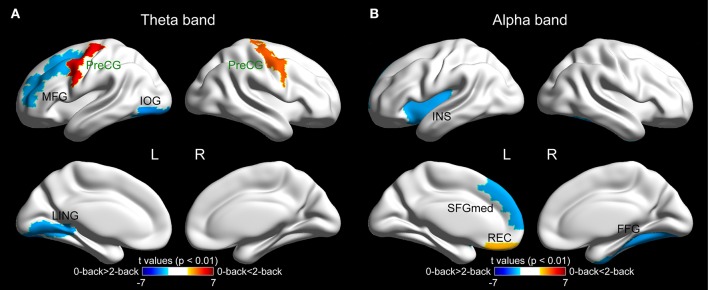
Figure 5.
The surface spatial distribution of the cortical regions showing significantly different betweenness centrality values between the 0-back and 2-back tasks (p < 0.01) in (A) theta band and (B) alpha band. The color bar represents the t-values of the corresponding regions obtained from paired t-test between the two tasks. The names of the regions that survived the FDR correction are highlighted in green. The brain regions were overlaid on inflated surface maps with the BrainNet Viewer toolbox (Xia et al., 2013). For the abbreviation of the cortical regions, see Table S1. L = left, R = right.

