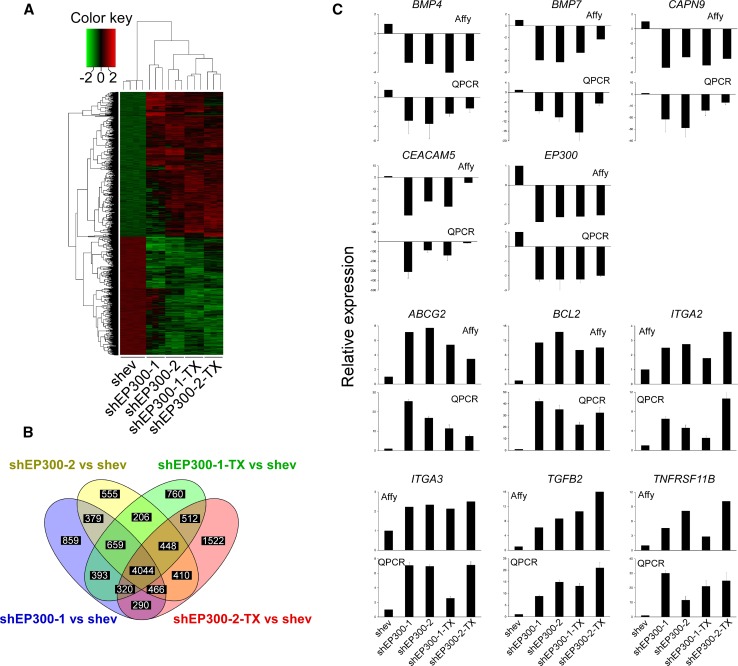
Fig. 5.
Genome-wide expression profile of EP300-downregulated MCF-7 cells, and their paclitaxel-resistant derivatives. a Hierarchical clustering of differentially expressed genes. Differentially upregulated expression values are shown in red, downregulated in green. Scale represents colour values corresponding to lg2 expression. b, Venn diagram indicating the number of differentially expressed genes in each of the pair-wise comparisons to MCF7-shev control cells. There were 4044 common differentially expressed genes present in all cells after downregulation of EP300. c Eleven genes were selected for validation by quantitative PCR. The top panel for each gene shows the normalized fluorescence from Affymetrix array expression data. The lower panel for each gene indicates the normalized QPCR data relative to the expression data obtained in control MCF7-shev cells. QPCR data represent the mean ± SD from three replicates

