
FIGURE 4.
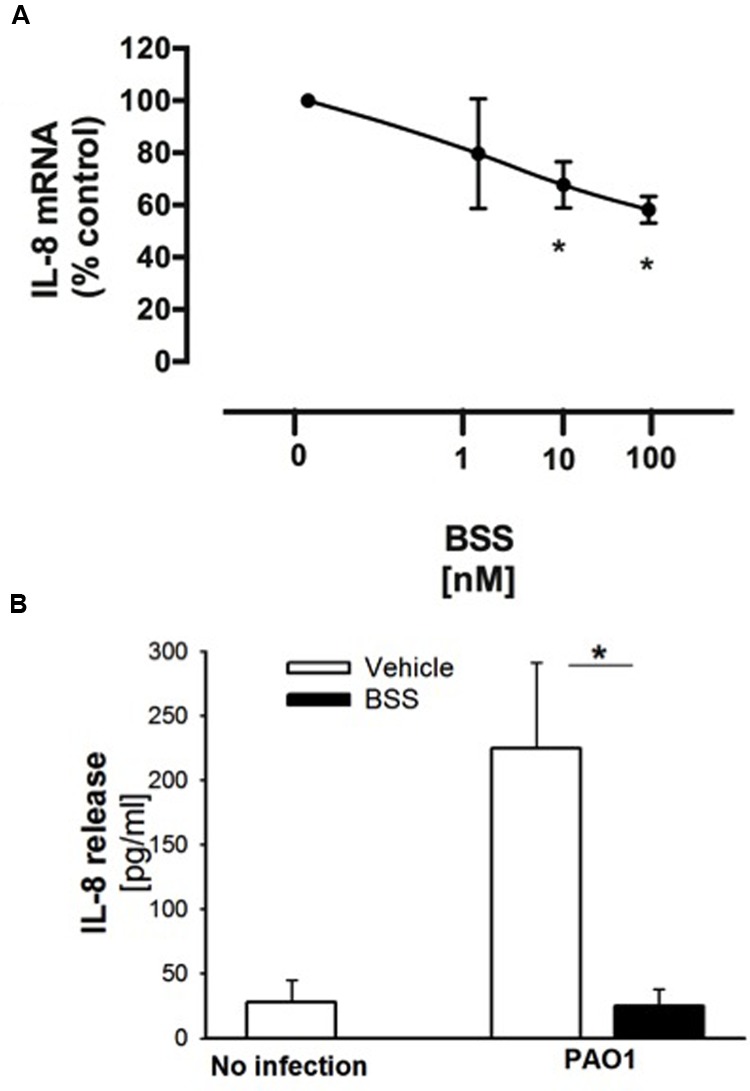
Effect of BSS on PAO1-stimulated IL-8 expression in IB3-1 cells. (A) IB3-1 cells were treated with ranging doses (1–100 nM) of BBS for 16 h and infected with PAO1 for further 4 h. IL-8 mRNA expression was measured as indicated in the legend of Figure 2. The results are expressed as the % of untreated cells. Data are mean ± SEM of three independent experiments performed in duplicate. (B) IB3-1 cells were treated with 100 nM BSS for 16 h and infected with PAO1 for further 4 h. IL-8 release in the supernatant was measured by ELISA assay. Representative experiment performed in duplicate.