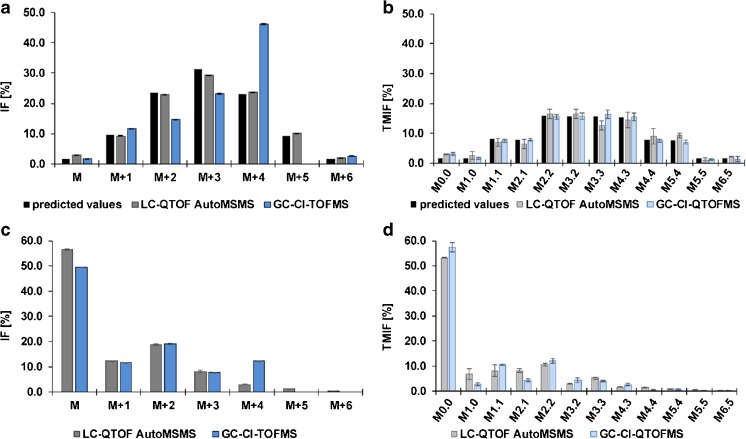
Fig. 2.
Isotopologue distribution and tandem mass isotopomer distribution of P. Pastoris cell extract, fed with either (a,b) 50: 50 = 12C1 methanol:13C1 methanol or (c,d) U13C glucose mixed with natural glucose (20: 80) [12, 17]. Data obtained from the PRM combined with data-dependent fragmentation LC-MS approach, indicated by “LC-QTOFMS AutoMSMS”, is shown in grey, whereas bars in blue depict the obtained fractions from the already published GC-CI-(Q)TOFMS approach. In Fig. 2a, the predicted values defined by the binomial coefficients found in Pascal’s triangle are depicted in black. As for the TMID in Fig. 2b, TMIFs were calculated according to the predictable distribution following an abstraction of one carbon of a C6 backbone. For Fig. 2a, b) n = 6, whereas for (c) and (d), three replicates were measured

