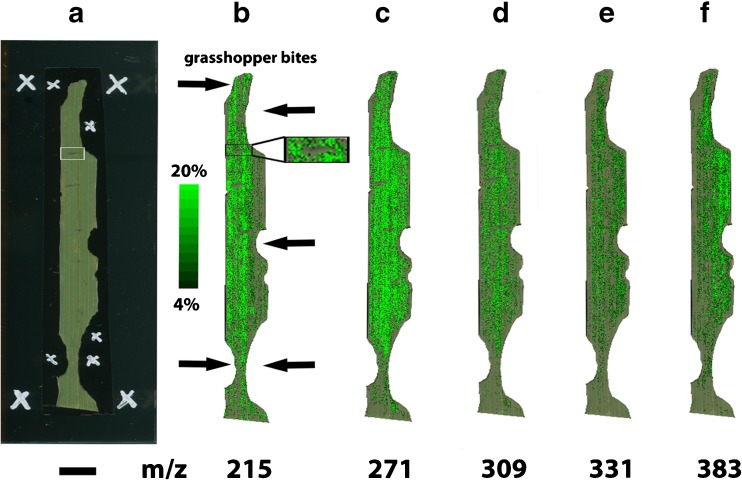
Fig. 2.
MALDI-TOF MSI analysis of a D. glomerata leaf. a Optical image taken before the matrix application, and ion images (green color) overlaid onto the optical image showing the distribution of b quinic acid (m/z 215), c apigenin (m/z 271), d luteolin (m/z 309), e tricin (m/z 331), and f rosmarinic acid (m/z 383)
Note: The assignments of the secondary plant metabolites are tentative based on the MS and MS/MS data of reference standards, as presented in the ESM, and additional MS and MS/MS experiments of methanol extracts of D. glomerata leaves, as shown in Figs. 3 and 4, respectively. The ion images are normalized using the TIC. Scale bar 5 mm (a)

