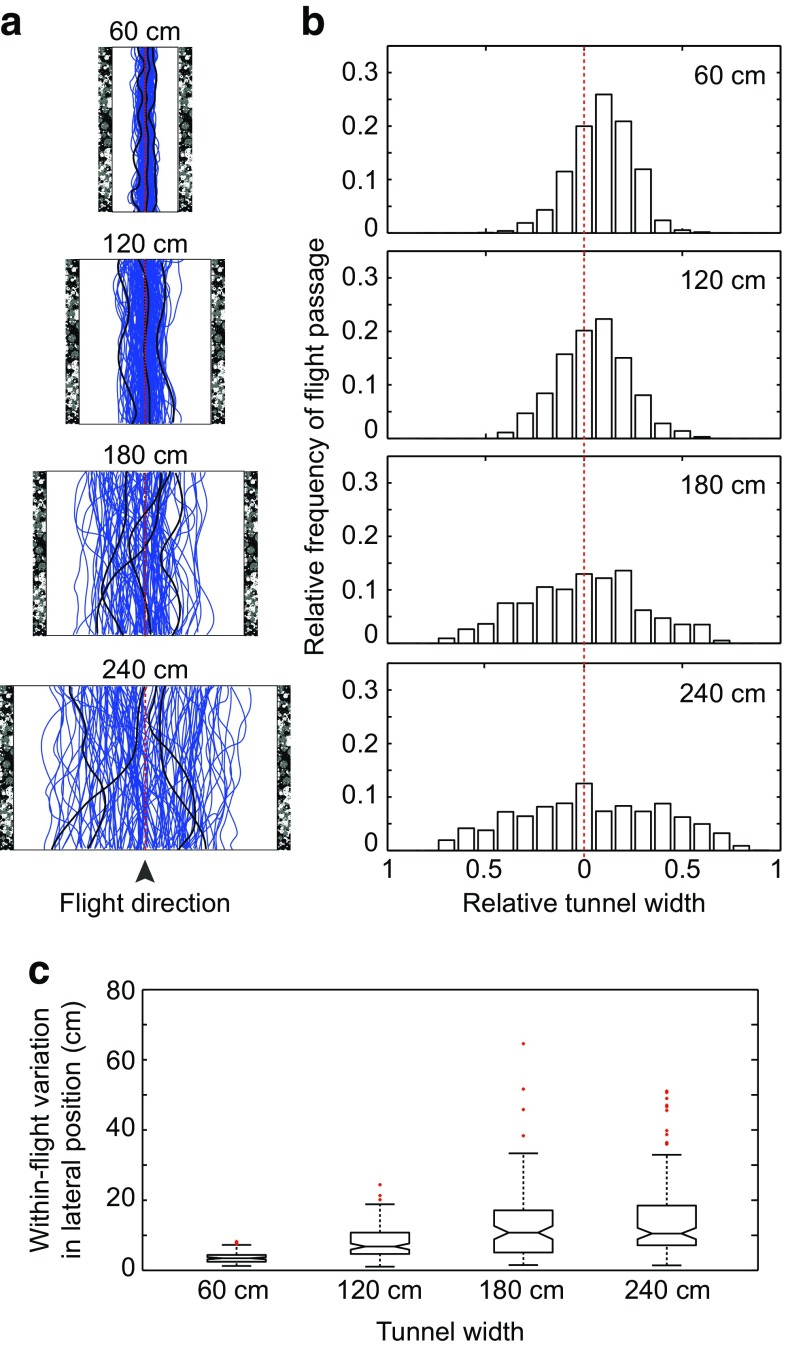
Fig. 2.
Effect of tunnel width on lateral position. Both tunnel walls were lined with a dead leaves pattern and the floor was white. a Raw flight trajectories of bees flying in the 60, 120, 180, and 240 cm-wide tunnels. Some individual examples are highlighted in black. b Relative frequency of flight passage in tunnels of different width. Each bar corresponds to a longitudinal strip that has a relative width of 5% of the tunnel diameter. The red dotted line represents the midline of the tunnel. c Within-flight variation (25–75% interquartile range) in lateral position. Boxes indicate the extent of the 25–75% interquartile range, the horizontal line indicates the median, whiskers indicate the full extent of the data, and red crosses represent outliers

