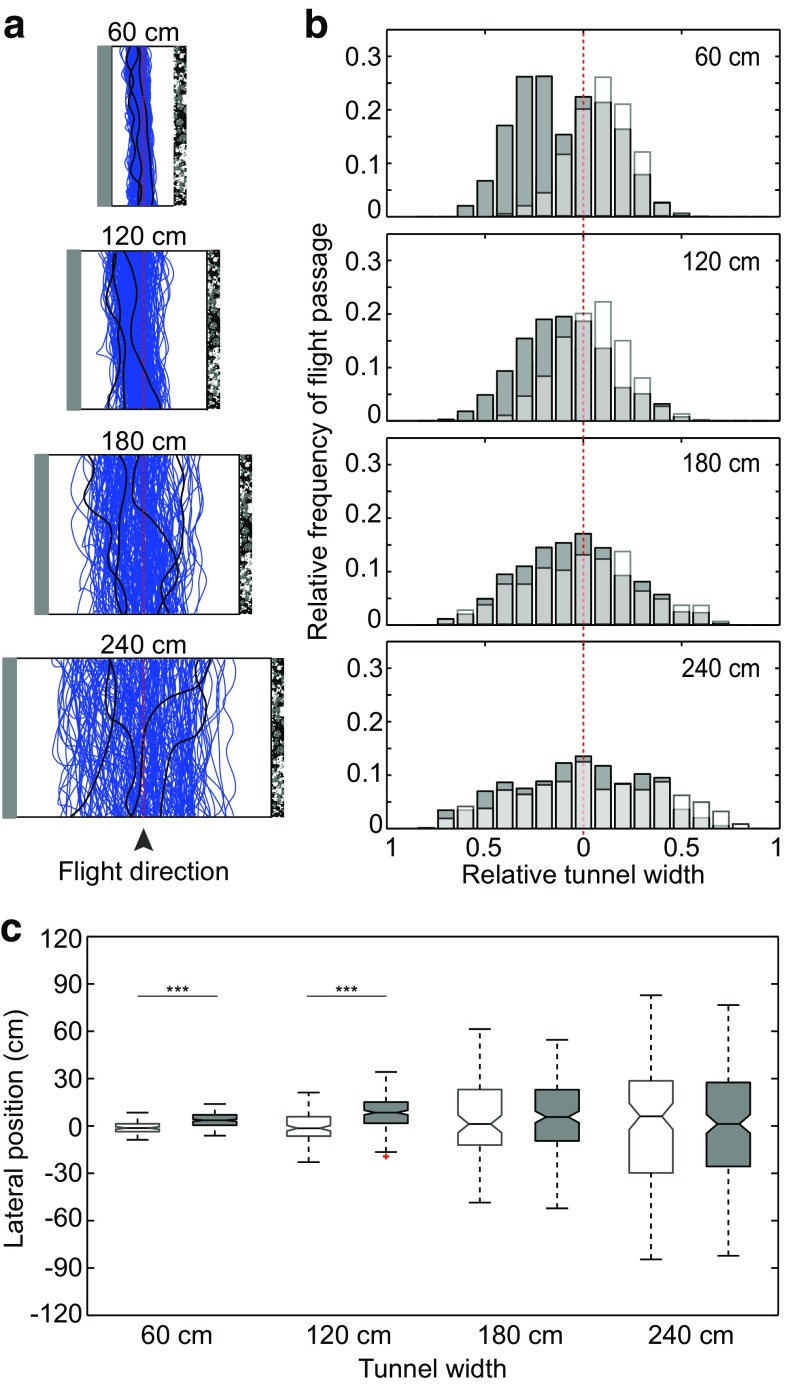
Fig. 3.
Effect of asymmetric optic flow input on lateral position. a Raw flight trajectories of bees flying in the 60, 120, 180, and 240 cm-wide tunnels when one wall was lined with a dead leaves pattern and the other wall was grey. The floor was white. Some individual examples are highlighted in black. b Relative frequency of flight passage in tunnels of different width. The plot contains data from two different conditions: dark grey bars represent the data from the condition in which the right tunnel wall was lined with dead leaves pattern and the left wall was lined with a homogenous grey pattern, white transparent bars represent the condition in which both walls were lined with dead leaves pattern. The light grey areas represent overlap between the two data sets. Each bar corresponds to a longitudinal strip that has a relative width of 5% of the tunnel diameter. The red dotted line represents the midline of the tunnel. c Median lateral position of bees flying in a tunnel lined with dead leaves pattern on both walls (white boxes) or in a tunnel lined with dead leaves pattern on the right wall and a homogenous grey pattern on the left wall (grey boxes). Positive and negative values indicate flights to the left and right sides of the midline, respectively. Boxes indicate the extent of the 25–75% interquartile range, the horizontal line indicates the median, whiskers indicate the full extent of the data, and red crosses represent outliers. Asterisks indicate the significance level (Wilcoxon rank-sum): ***p < 0.001

