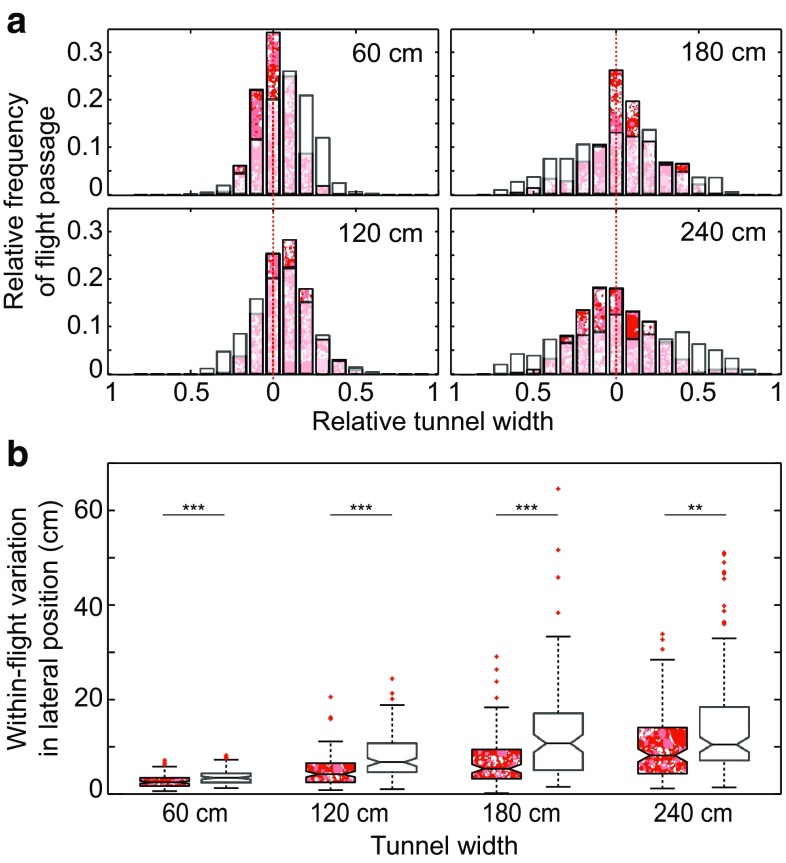
Fig. 4.
Effect of ventral optic flow on lateral position. The floor was either white or lined with a red dead leaves pattern. Both walls were lined with a dead leaves pattern. a Relative frequency of flight passage in tunnels of different width. The plot contains data from two different conditions: dark red patterned bars represent flights over a patterned floor (data from Linander et al. 2016), and white transparent bars represent flights over a white floor. The light red patterned areas represent overlap between the two data sets. Each bar corresponds to a longitudinal strip that has a relative width of 5% of the tunnel diameter. The red dotted line represents the midline of the tunnel. b Within-flight variation (interquartile range) in lateral position for bees flying in a tunnel lined with dead leaves pattern on the floor (patterned boxes, data from Linander et al. 2016) or of bees flying over a white floor (white boxes). Boxes indicate the extent of the 25–75% interquartile range, the horizontal line indicates the median, whiskers indicate the full extent of the data, and red crosses represent outliers. Asterisks indicate the significance level (Kruskal–Wallis test): **p < 0.01, ***p < 0.001

