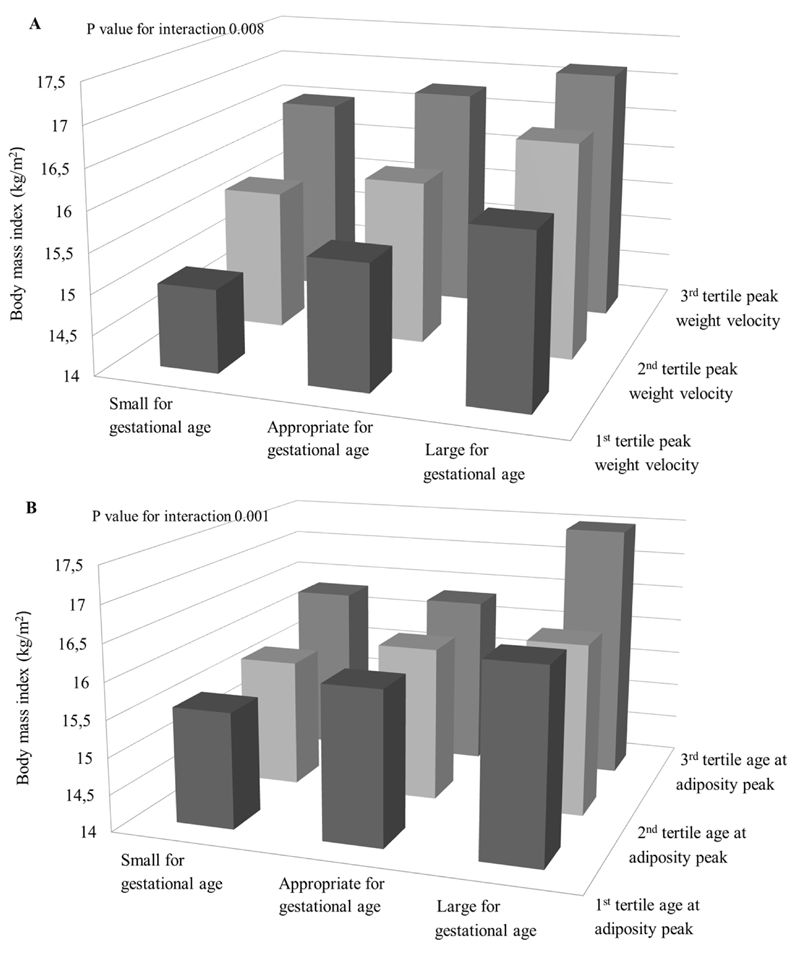
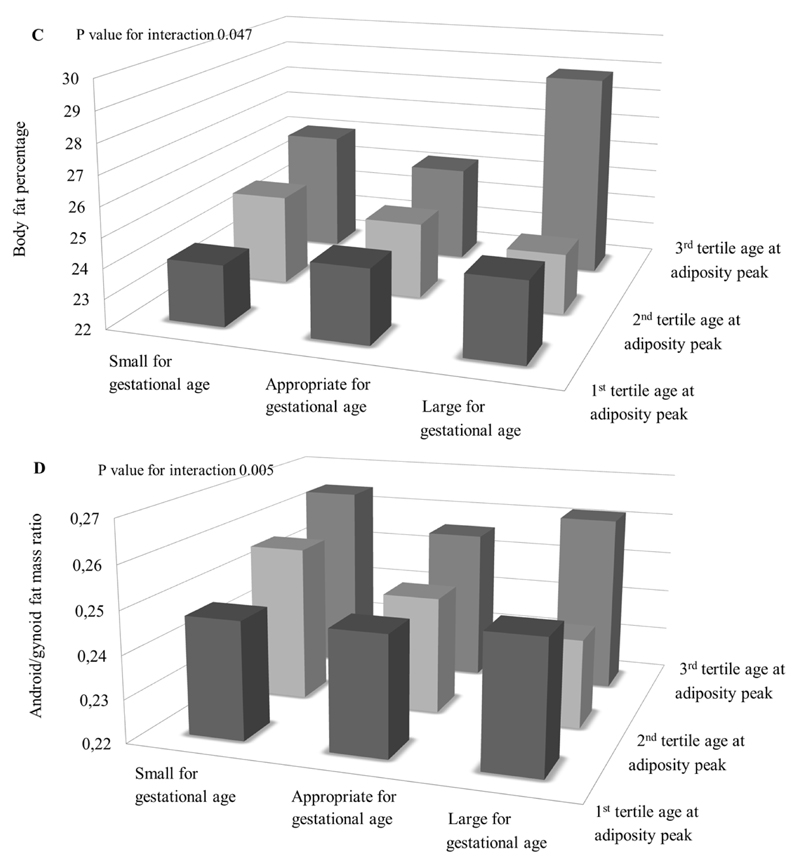
Figure 2. Size at birth, infant weight growth and childhood adiposity outcomes (N=5,126).
Bars represent mean body mass index (BMI) (A, B), body fat percentage (C) and android/gynoid fat mass ratio (D) stratified by size at gestational age and peak weight velocity (A) and age at adiposity peak (B, C, D) (tertiles). P<0.01 for interaction between peak weight velocity and standard deviation score birth weight for the association with BMI, P<0.01 for interaction between age at adiposity peak and standard deviation score birth weight for the association with BMI and android/gynoid fat mass ratio, P<0.05 for interaction between age at adiposity peak and standard deviation score birth weight for the association with body fat percentage. SGA, PWV: 1st tertile N=172; 2nd tertile N=181, 3rd tertile N=166. AGA, PWV: 1st tertile N=1,309, 2nd tertile N=1,373, 3rd tertile N=1,400. LGA, PWV: 1st tertile N=225, 2nd tertile N=152, 3rd tertile N=140. SGA, AGEAP: 1st tertile N=254; 2nd tertile N=158, 3rd tertile N=64. AGA, AGEAP: 1st tertile N=2,324, 2nd tertile N=1,128, 3rd tertile N=291. LGA, AGEAP: 1st tertile N=363, 2nd tertile N=97, 3rd tertile N=17.


