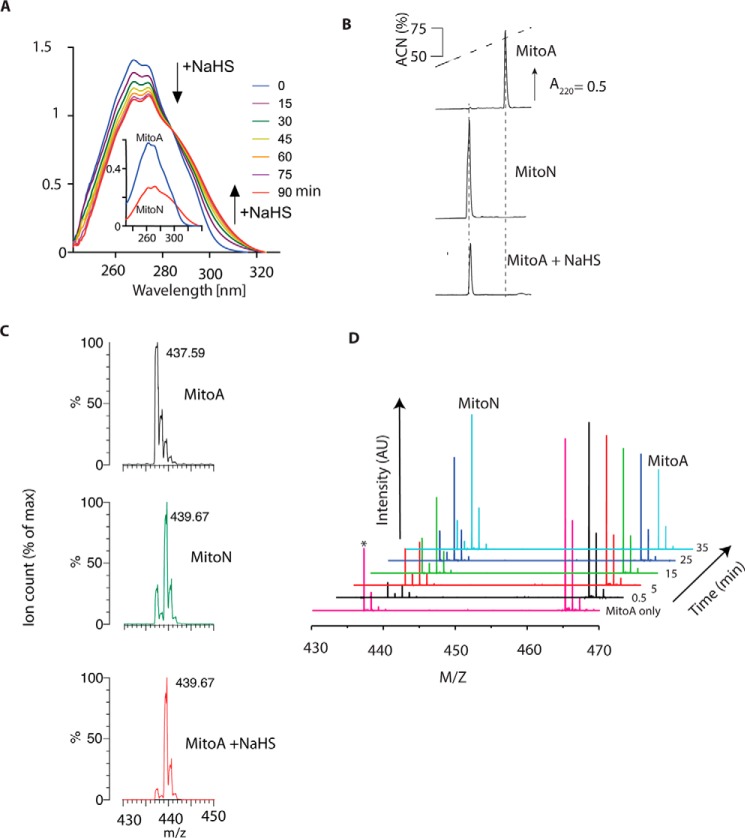
Figure 2.
Reaction of MitoA with H2S to form MitoN. A, UV-visual absorbance spectra of MitoA reacting with NaHS. MitoA (50 μm) in KCl buffer was mixed with 5 mm NaHS and spectra were taken every 15 min. The inset shows spectra of pure MitoA and MitoN (25 μm each). B, RP-HPLC analysis of MitoA, MitoN, and its reactivity with H2S. Standards of 10 nmol of MitoA (upper trace) or MitoN (middle trace) were separated by RP-HPLC. For the lower trace MitoA (100 μm) in KCl buffer was incubated overnight with 1 mm NaHS at room temperature. Then 5 nmol eq of starting MitoA was analyzed by RP-HPLC. Spiking the NaHS-treated MitoA with MitoN increased the MitoN peak (data not shown). C, mass spectra of MitoA, MitoN, or MitoA incubated overnight with NaHS. Mass spectra were taken of MitoA (100 μm), MitoN (100 μm), or MitoA (100 μm) incubated with 1 mm NaHS in KCl buffer, pH 7.2, overnight at room temperature. Samples were diluted in 20% ACN, 0.1% FA and analyzed within 5 h. Predicted m/z: MitoA, [C28H26N4OP]+ = 465.18; nitrene from neutral loss of N2, [C28H26N2OP]+ = 437.17; MitoN, [C28H29N2OP]+ = 439.19. The MS of MitoA incubated at room temperature overnight was the same as that for freshly prepared MitoA (data not shown). D, time-resolved analysis of the reaction of MitoA with H2S. MitoA (100 μm) was mixed with 2.5 mm H2S in 300 mm ammonium carbonate, pH 7.4, and sprayed continuously over 45 min into an ultra high resolution mass spectrometer (maXis Bruker Daltonics). Spectra at selected time points are shown. Asterisk shows the nitrene formed from MitoA by the neutral loss of N2.

