Figure 4.
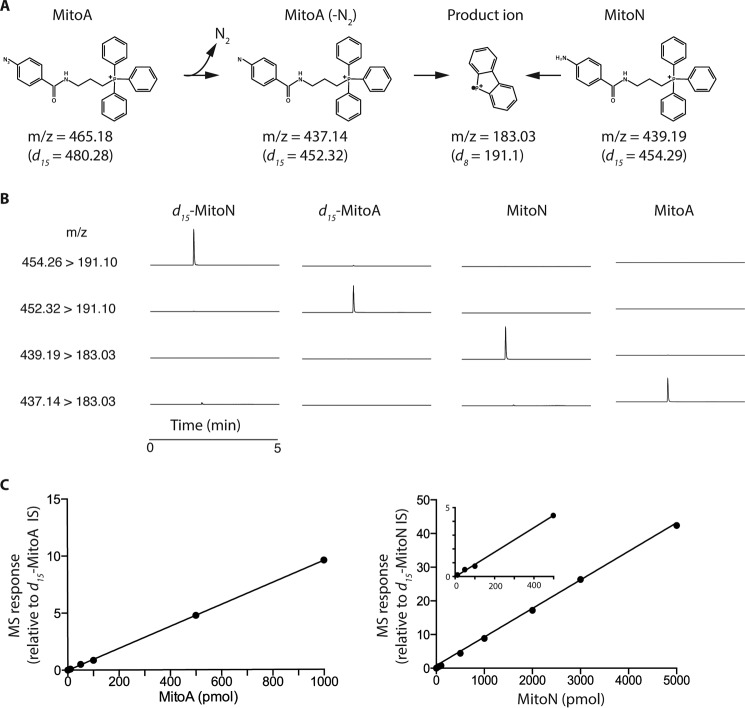
Detection of MitoA and MitoN by LC-MS/MS. A, the transitions used for analysis of MitoA and MitoN, and their deuterated derivatives, are shown. B, typical chromatograms showing the m/z transitions measured simultaneously for 50 pmol of d15-MitoA, MitoA, d15-MitoN, or MitoN. Each trace is normalized to the highest total ion count peak within that trace. C, typical standard curves for MitoA and MitoN detection by LC-MS/MS. Samples were prepared in 20% ACN, 0.1% FA and contained known MitoA or MitoN concentrations and their deuterated internal standards. Each point is mean ± range of duplicate measurements.

