Figure 5.

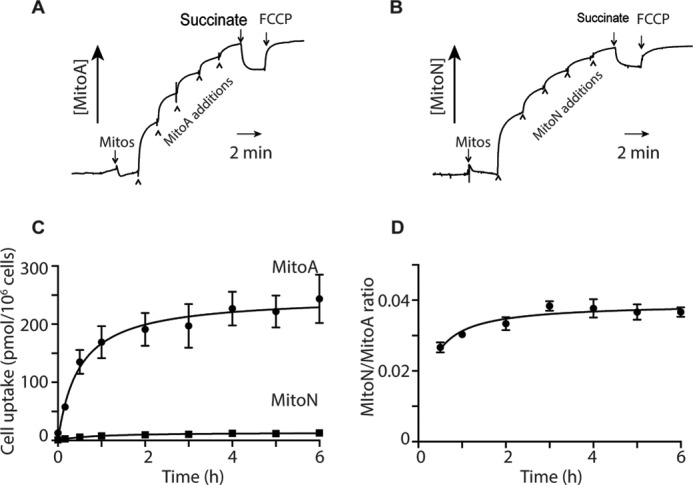
Accumulation of MitoA and MitoN by isolated mitochondria and cells. The uptake of MitoA (A) and MitoN (B) was examined in isolated mitochondria (2 mg of protein/ml) incubated in KCl medium supplemented with 4 μg/ml of rotenone and 100 nm nigericin using a TPP-selective electrode. The compounds were added in 1 μm steps, followed by 10 mm succinate and 500 nm FCCP. C, MitoA uptake by HCT116 cells. HCT116 cells were plated at 250,000 cells/well (∼27,000 cells/cm2) in 6-well plates overnight and then incubated with 10 μm MitoA in DMEM containing 10% FBS and antibiotics. At various times 1 ml of supernatant was removed for analysis, the rest was discarded, and the cells were rinsed with 1 ml of PBS and collected by scraping into 0.5 ml of PBS and pelleted by centrifugation (16,000 × g, 3 min, room temperature). Cell pellets were snap frozen and stored at −20 °C. Compounds were extracted and quantified by LC-MS/MS. Results are mean ± S.E. for n = 3. MitoA levels in the supernatant did not change over 6 h (data not shown). D, for the experiment in C, the level of MitoN in the cell pellets were assessed in parallel with MitoA and the MitoN/MitoA ratio is shown.
