Figure 6.

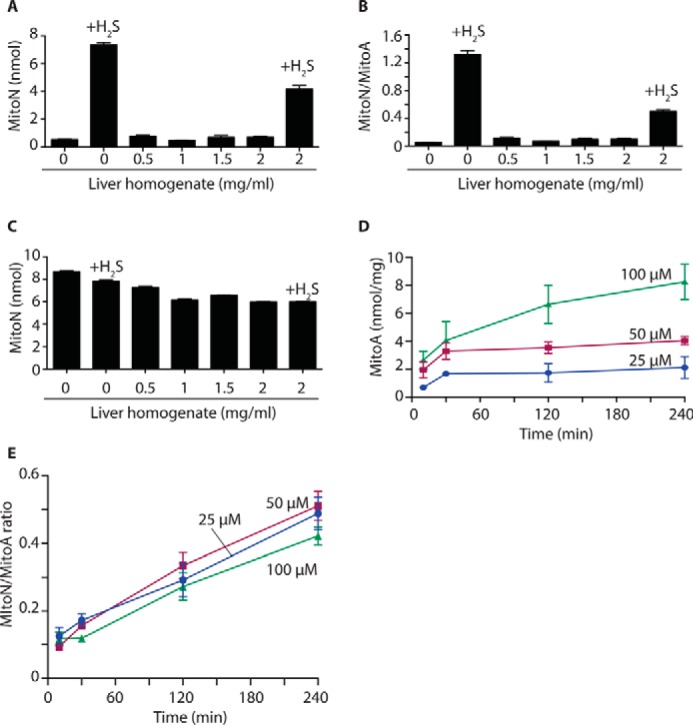
MitoA and MitoN metabolism in the liver ex vivo. A and B, MitoA metabolism by a liver homogenate. MitoA (10 μm) was incubated with various amounts of liver homogenate, or with liver homogenate and NaHS (25 μm), for 2 h at 37 °C. Samples were then analyzed by LC-MS/MS to quantify MitoA (data not shown), MitoN (A), and the MitoN/MitoA ratio (B). Data are mean ± S.E., n = 3. C, MitoN metabolism by a liver homogenate. MitoN (10 μm) was incubated with various amounts of liver homogenate, or with liver homogenate and NaHS (25 μm), for 2 h at 37 °C. Samples were then analyzed by LC-MS/MS for MitoN. Data are mean ± S.E., n = 3. D, uptake of MitoA by liver sections. Rat liver sections of ∼20 to 50 mg wet weight were incubated with MitoA in University of Wisconsin solution at 4 °C. After incubation, the tissue pieces were rinsed in PBS, dried, and snap frozen prior to quantification of MitoA and MitoN by LC-MS/MS. Data show the accumulation of MitoA over time and are mean ± S.E., n = 3. E, MitoN/MitoA ratio in liver sections. The MitoN/MitoA ratio was determined over time in liver sections as described in D.
