Figure 7.
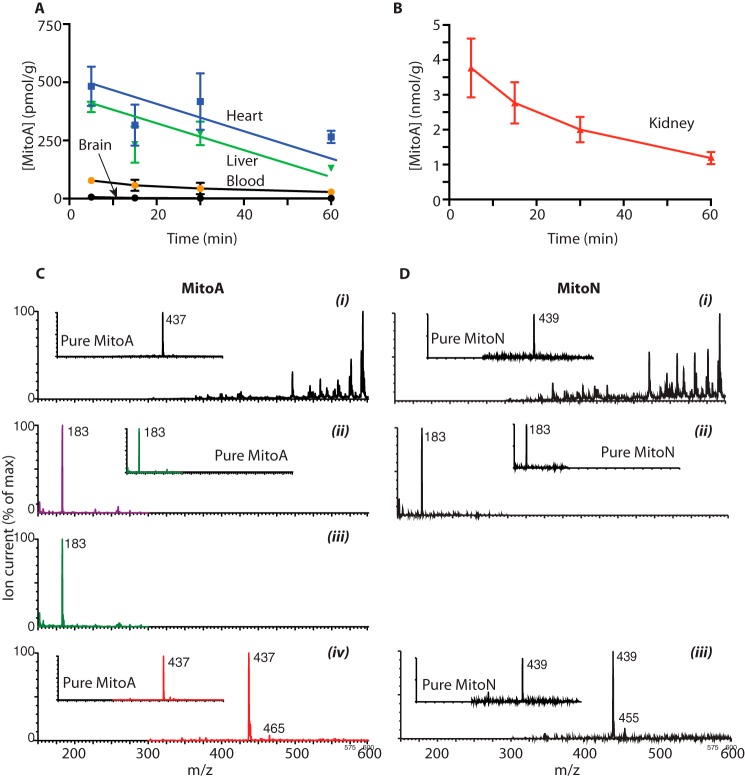
Uptake and metabolism of MitoA in vivo. A and B, mice were injected with 50 nmol of MitoA and tissues were collected, extracted, and analyzed by LC-MS/MS. Results are mean ± S.E., n = 3. C, MitoA (50 nmol) was administered to mice. After 60 min the liver was collected, extracted, and prepared as for mass spectrometry (LC-MS/MS) but omitting the internal standards and analyzed by mass spectrometry by direct infusion at 5 μl/min. C, i, shows the mass spectrum of the liver extract. ii, shows the MS/MS spectrum of the liver extract assessed for MitoA (437 > 183). The inset shows the MS/MS spectrum for pure MitoA. iii, shows the MS/MS spectrum of the liver extract assessed for MitoN (439 > 183). The inset shows the MS/MS spectrum for pure MitoN. iv, shows the precursor scan of the liver extract assessed for precursor ions that generate a product ion of m/z 183. The inset shows the precursor ion scan for pure MitoA. D, MitoN (50 nmol) was administered to mice. After 60 min the liver was collected, extracted into solvent, and prepared as for mass spectrometry, but omitting the internal standards, and analyzed by MS by direct infusion at 5 μl/min. D, i, shows the mass spectrum of the liver extract. ii, shows the MS/MS spectrum of the liver extract assessed for MitoN (439 > 183). The inset shows the MS/MS spectrum for pure MitoN. iii, shows the precursor scan of the liver extract assessed for precursor ions that generate a product ion of m/z 183. The inset shows the precursor ion scan for pure MitoN. For all spectra the maximum ion counts are indicated on the spectra and all ion counts are expressed as % of the maximum.

