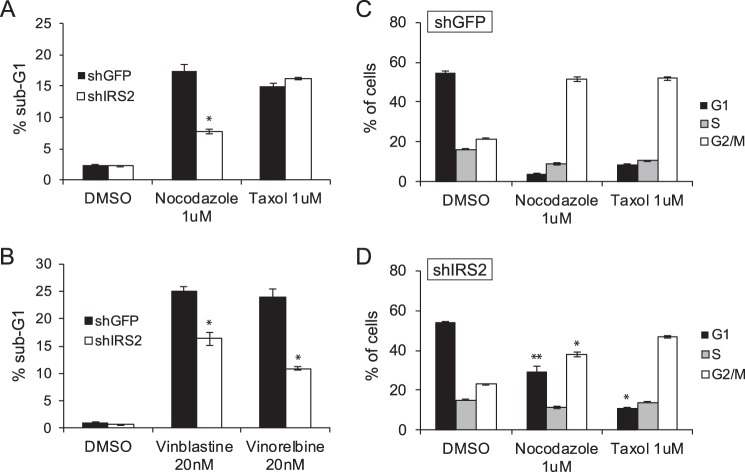
Figure 4.
The Role of IRS-2 in the cellular response to microtubule disruption. A—D, MDA-MB-231 cells were treated with DMSO or the indicated drugs for 48 h. The cells were stained with propidium iodide and analyzed by flow cytometry. Shown are the percentages of cells in the sub-G1 peak (A and B) or cell cycle stages (C and D). The data shown represent the mean of representative experiments performed three times (± S.E.) (nocodazole, vinblastine, and vinorelbine) or twice (± S.D.) (Taxol) independently. *, p ≤ 0.05 relative to shGFP; **, p ≤ 0.01 relative to shGFP.

